Cosmetic emollients, especially oils, are commonly used in formulations for their hydrating properties.1 In terms of their sensory characteristics, however, there is a gap in the literature for specific descriptors as well as global standards that support their characterization. One descriptive method, the Quantitative Descriptive Analysis profile (QDA profile), is well-known and allows for the qualification and quantification of sensory differences between products.2
The QDA profile is designed to provide results when detailed sensory profiles of oils and other raw materials are required for several products compared globally at different in-use steps—i.e., when opening products, gliding between the fingers, at application and after application. However, one disadvantage of the QDA profile is the panel calibration process.
During a long and intensive training period, panelists learn about different sensations and are taught to grade them similarly, providing ratings for intensity on specific scales. This step challenges companies to collect consistent results, in addition to the calibration time it takes to evaluate a product.3
Alternative sensory tests, including Flash Profiling, Projective Mapping and Sorting Tasks,4–8 were developed a couple of years ago to produce the same results as QDA profiling but more efficiently. However, few of these applications have been used in the cosmetic industry.4, 7, 8 In current sensory testing, consumers are often recruited and one or two sessions are necessary to gather global sensory perceptions about a product range. For these alternative tests, final users are recruited in order to avoid training an expert panel.
As such, the aim of the present study was to develop a means for the global sensory comparison of nine oils used in cosmetic formulations. This comparison would then allow the chemist to select an oil based on its standardized sensory characterization.
The presented alternative methodology, called “Oil Sensory Qualification,” was developed to replace QDA profiling. It involved defining six key desired attributes for the nine oils, then evaluating each oil individually and choosing the best two attributes demonstrated for a given oil. The oils were then mapped according to their top attributes to speed the emollient selection process.
Here, chemists were recruited for their experience with oils to evaluate the oil attributes during and after application. The different steps are described as follows.
Important to the success of this method were
the six attributes chosen for assessment.
Test Protocol: Oil Sensory Qualification
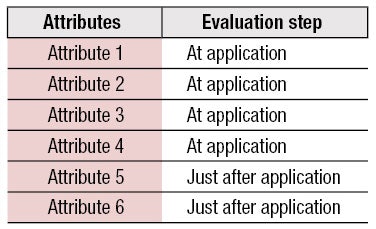
As stated, chemists (n = 10) were recruited to perform the Oil Sensory Qualification based on their experience in formulating with oils. A short training session was performed, which outlined standards to ensure the six attributes and evaluation protocols were understood (see Table 1). [Editor’s note: For proprietary reasons, the six attributes are generalized in the present article.]
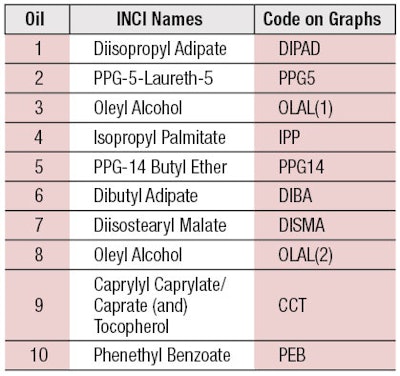
Ten samples in total were tested, with one oil presented twice to measure the repeatability of the panel (see Table 2). Samples were identically packaged and presented by a random three-digit numeric code, balanced following the Latin Square plan.
The formulation chemists tested the samples one by one and to answer the sensory questionnaire. They applied one drop of oil to the volar forearm and evaluated, during 90 sec, four attributes upon application and two attributes after application.
At the end of the evaluation, the chemists chose the best two sensory attributes provided by each oil during and after application and recorded their choices in the sensory questionnaire. Assessments were performed under standard testing conditions; i.e., independently, in a room having controlled temperature and humidity, etc.9
Oil assessment data was collected for each sample. The preferred attributes chosen by panelists were graded as “1,” while the others were graded as “0.” The total results for each oil were compiled in a global matrix to perform a multidimensional statistical analysis, referred to as a Correspondence Analysis (CA).10 Statistical analysis was performed using software.
Mapping Results
A global representation of the sensory differences between the nine oils was obtained by CA (see Figure 1); here, 83% of the information is represented on the two axes.
Axis description: On the horizontal axis, Attribute 3 corresponded to the bottom right corner of the map, opposite Attributes 1 and 2. On the vertical axis, Attribute 4 rose to the top area of the sensory map, opposite of Attribute 3. Attributes 5 and 6 fell in the middle of the map.
Oil description: Two groups of oils were clearly differentiated on the horizontal axis: IPP, DIBA, DIPAD and CCT, on the left side of the map. Clearly, these four oils can be discriminated from the others as they are more defined by Attributes 1 and 2. On the other hand, PPG14 and DISMA rated at the lower-right side of this axis; therefore, PPG14 and DISMA are more characterized by Attribute 3.
Furthermore, two groups of oils were differentiated on the vertical axis. PEB, OLAL(1) and OLAL(2) rated at the top of the map, as they are well-represented in this second axis. They were more defined by Attribute 4 and different from the other oils.
The Oil Sensory Qualification method created
quick comparisons between raw materials.
Discussion
As illustrated by this exercise, nine raw materials could be evaluated and clearly discriminated by experts thanks to this new sensory approach. The CA represents the global sensory differences between the nine oils. Important keys to the success of this method were the six attributes chosen. Their selection and the outlined standards were important to ensure the chemists could discriminate between the oils and clearly understand the sensations each imparted.
Impressively, only one 45-min session was necessary to assess the nine raw materials using this method—use of the QDA profile and an expert panel would have taken much longer to obtain consistent results and a global sensory representation of the nine raw materials. The outcome provided chemists with a quick sensory qualification for these raw materials to aid with formulating decisions in cases where two raw materials provided similar pH and stability results. Moreover, the Oil Sensory Qualification enabled the development of an internal sensory classification for raw materials received from different suppliers.
While the Oil Sensory Qualification method showed positive results, areas for improvement were identified. For example, the OLAL assessed twice during the trial resulted in both samples in the same CA map group, validating the consistency of the panel; however, this preliminary study could be replicated to evaluate consistency over time; i.e., one year later.4–8 This method could also be extended to different raw material categories such as thickeners; or to help make quick comparisons between raw materials during the formulation process..
In addition, future iterations could compare expert with consumer perceptions to understand differences. Indeed, research of wine and fragrances shows that oenologists and perfumers can perceive small sensory differences without test panel training.11
Such insight into the final user’s sensory experience of finish products, e.g., facial oils and other products, could prove useful to cosmetic companies.
Conclusions
This first trial of the described approach demonstrated positive results for the sensory differentiation of a challenging raw material. It could therefore provide cosmetic companies with a quick and cost-effective means to evaluate raw materials to support chemists during the formulation process.
Acknowledgements: The author would like to thank the Oriflame R&D formulation chemists: Meltem Ozmus, Delphine Wittenberg and Eve Merinville for their participation. She would also like to thank all reviewers for their constructive comments.
References
- AM Pensé-Lhéritier, Conception des produits-la formulation, Coll Cosmetic Valley France, Lavoisier (2014)
- H Stone and JL Sidel, Sensory evaluation practices, Global Cosmetic Industry (2004)
- GV Civille and AS Szczesniak, Guidelines to training a texture profile panel, J Texture Stud 4(2) 204–223 (1973)
- M Santosa, H Abdi and JX Guinard, A modified sorting task to investigate consumer perceptions of extrac virgin oils, Food Quality and Preference (21) 881–892 (2010)
- V Dairou and JM Sieffermann, A comparison of 14 jams characterized by conventional profile and a quick original method, the Flash Profile, Journal of Food Science 67(2) 826–34 (2002)
- P Faye, D Bremaud and M Durand Daubin, Perceptive free sorting and verbalization tasks with naıve subjects: An alternative to descriptive mappings, Food Quality and Preference 15(7–8) 781–791 (2004)
- A Gambaro, ME Parente and A Gimenez, Free-choice profile descriptive analysis with conditioning agents, J Cosmet Sci (57) 455–63(2006)
- ME Parente, G Ares and AV Manzoni, Application of two consumer profiling techniques to cosmetic emulsions, J Sensory Studies (25) 685–705 (2010)
- ISO 8589, Sensory analysis—General guidance for the design of test rooms (2007)
- B Escofier and J Pages, Multiple factor analysis, Computational Statistics & Data Analysis (18)121–140 (1994)
- M Nestrud and H Lawless, Perceptual mapping of citrus juices using projective mapping and profiling data from culinary professionals and consumers, Food Quality and Preference 19(4) 431–438 (2008)


