The first part of this article presented an argument to define yield stress as the stress below which no flow can be observed under the conditions of experimentation.1 Static and dynamic yield stresses were defined as the minimum yield stress required to initiate flow from rest, and to sustain a flowing state, respectively. Next, the importance of timescale in yield stress measurements was highlighted. Specifically, the Deborah number De was discussed as an important timescale, given by the ratio of a material’s relaxation time to the time of observation.
It then was demonstrated how long timescales, given by De→0, are relevant for suspending applications, and faster timescales are relevant for processing and robustness applications. Finally, a method was given for determining if a material has a yield stress at a timescale of interest, and a method was outlined to calculate how much yield is needed for a given application.
This article continues the discussion by demonstrating and critiquing several methods to measure yield stress. Each method is used to evaluate two relevant materials and the results are compared in terms of relevance, exactness and robustness.
Measurement Considerations
Many methods exist to measure yield stress, ranging from rotational rheometers and viscometry data extrapolation, to inclined plane testing. The present discussion will be limited to tests commonly performed on rotational rheometers and simple viscometers. To ensure repeatability and robustness in yield stress measurements, it is critical to follow proper sample preparation protocols, especially for thixotropic materials, which often exhibit yield stress behavior.
Thixotropic materials generally possess microstructures that evolve and respond with respect to time and mechanical agitation. Thus, rheological responses of these materials are highly sensitive to their shear history.2-5 For example, paint has a relatively low viscosity when it is applied to a wall under high shear, i.e., from the brush or roller, but when the brush is removed, it quickly thickens due to an evolving microstructure.
This thixotropic behavior is built into the product by design. Paints must give good coverage during application, but not run and drip after application. Thus, the rheological profile of paint will look very different depending on the shear history of the sample or amount of time that passes after its application to a surface and before measurements are made.
To achieve robustness and consistency when measuring a material, it is good to ensure the material microstructure is in the same state before conducting an experiment. This can be achieved by performing a pre-shear followed by a quiescent period; the pre-shear erases any structure present in the sample and the quiescent period allows the structure to rebuild in a reproducible manner.
The duration of the quiescent waiting time should be consistent for a given sample and sufficient enough so the microstructure can sufficiently rebuild. A protocol such as this is the best way to ensure the sample microstructure is in a similar state prior to every experiment.
Materials and Methods
Several methods of determining yield stress will be illustrated here for two types of samples: a generally non-thixotropic material comprised of a 2% acrylates copolymer solution and a thixotropic body wash comprised of multilamellar surfactant vesicles. Both materials have a yield stress due to the presence of a space-filling, jammed network—i.e., swollen copolymer in the solution and surfactant vesicles in the body wash.
All experiments were performed at 25°C on several rheometersa-c with cone and plate geometries. The 2% w/w acrylates copolymer solution was at a pH of 6.5 and the body wash was a finished formula, used as received. Prior to every experiment, a pre-shear of 10 s-1 was applied for 30 sec, followed by a waiting time of two min.
Remember, the shear rate—also called the strain rate—is defined as the number of strain units per second, which the sample experiences. In a rotational rheometer, the strain is defined as the angular displacement normalized by the gap between the plates or: γ = θ/h, where γ is the strain, θ is the angular displacement and h is the gap height.
For example, if the gap between two parallel plates is 1 mm, the sample has experienced a strain of one (or 100%) when the rotating plate has turned an angular displacement equal to the gap height, or an angular displacement of 1 mm. At a shear rate of 10 s-1 the sample experiences 10 strain units of deformation every second.
Note, it is important to monitor for slip when performing yield stress measurements. While the present experiments were free from wall slip, if encountered, sometimes utilizing roughened plates or other geometries such as a vane and cup or vane and slotted cup can prevent it.6, 7 If slip is present, most data calculated by the instrument software, e.g., viscosity and shear rate, will be incorrect. This is due to the fact that the software assumes no-slip boundary conditions at the plate surfaces.
Flow Curve
One of the most common methods of determining the yield stress is by fitting a flow curve, sometimes called a viscosity step/ramp test, to the Herschel-Bulkley (H-B) model (see Equation 1),7 where σ is the stress, σγ is the yield stress, k is a constant and n is the power-law index. Fitting to the H-B model often can be done in the analysis software provided by the rheometer manufacturer or manually by fitting measured stress vs. shear rate data to the model using least squares analysis. This method is versatile because it can determine both the static and dynamic yield stresses by ramping the stress or shear rate in an increasing or decreasing manner, respectively.
Fitting can be performed on both steady-state and unsteady flow curves, but when comparing yield stress values across samples, it is best to use steady-state flow curves. One drawback to fitting the H-B model to flow curves is the quality of the results, which strongly depends on the quality of data and chosen fitting range, i.e., fitting to the entire dataset or truncating the fit at low or high stresses or shear rates.
For the present comparisons, steady-state flow curves were obtained for the two test samples by ramping the shear rate up and then down while monitoring the stress. The resulting data as well as the H-B fits are shown in Figure 1. The static yield stress values obtained by fitting the increasing ramp were 7.1 Pa and 4.1 Pa for the acrylates copolymer solution and body wash, respectively. The corresponding dynamic yield stress values for the solution and body wash, obtained by fitting to the decreasing ramp, were 6.0 Pa and 1.1 Pa, also respectively.
Regarding fitting, extra care should be taken when extracting yield stress values from fitted data. For example, the yield stress value obtained from a fit to the H-B equation can vary significantly depending on the range of data over which the fitting is performed, as mentioned previously. In Figure 1b, the data suggests two separate yielding events and it is unclear whether to fit the H-B model to the entire range of data or to only the first yielding event at low shear rates. This apparent “double yielding” phenomenon seen here could be an artifact resulting from slip at the rheometer/sample interface;8 however, multiple flow curves were generated using roughened surfaces and varying gap heights, which should cause variation in the data if slip was occurring.8
No dependence on roughness or gap was seen here (data not shown), so it is likely the double yielding phenomenon is not an instrumental artifact. Such multiple yielding events can occur when a sample yields and begins to flow, but parts of the microstructure still remain intact. These parts fully yield at higher stresses and the sample flows as one homogeneous fluid.
In this sample, the jammed vesicle network likely yields initially, but flocs of vesicles remain intact and flow past each other, possibly with some jamming. These later break up at higher stresses and the microstructure then consists of individual vesicles flowing. If the H-B model is fit to the entire range of data, the yield stress values obtained vary by nearly a factor of two, compared with the value obtained by fitting the initial yielding event.
Stress Ramping
Another common method of determining yield stress is by ramping the stress from a value below the yield stress to a value above it, while monitoring the viscosity. Generally, the material will exhibit a high creep viscosity below the yield stress and once the yield stress is reached, the viscosity will drop precipitously by many orders of magnitude over a small range in stress. The stress value at which this sudden drop in viscosity occurs is taken to be the yield stress.
The stress ramp is advantageous because it is easy to perform and the data is simple to analyze, but there are drawbacks. First, the rate at which the stress is ramped can have an effect on the yield stress value obtained. Second, instrumental artifacts can sometimes affect data below the yield stress. The stress ramp test can be performed at any desired ramping rate and the stress can be ramped linearly or logarithmically, depending on the instrument.
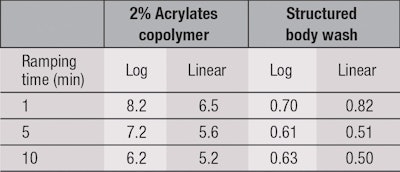
To illustrate the effects of experimental parameters, the stress was ramped linearly and logarithmically from 0.1 Pa to 20 Pa for the acrylates copolymer solution, and from 0.01 Pa to 20 Pa for the body wash, over 1 min, 5 min and 10 min. The results are displayed in Figure 2.
Above the yield stress, the measured viscosity does not appear to depend on the ramping rate or type; however, below the yield stress, the measured viscosity values appear to follow different trends depending on the nature of the stress ramp: linear or logarithmic. The cause of this discrepancy is unclear, but it has been confirmed over different samples and instrument manufacturers.
Regardless, the yield stress is commonly taken as the stress at maximum viscosity for the linear ramp, and the onset point of the low-stress plateau region and the sudden decrease after the yield stress for the log ramp. These methods give clear values for the non-thixotropic acrylates copolymer solution in Figure 2a, but the situation is not so clear-cut for the thixotropic body wash in Figure 2b, which suggests this method may not be suitable for complex systems or materials with appreciable thixotropy.
Again, there appear to be two distinct yielding events for the thixotropic body wash. Yield stress values obtained by the stress ramp method are listed in Table 1.
Steady Shear
In the steady shear method, sometimes called the stress growth method, the yield stress is measured simply by applying a constant shear rate and measuring the stress in the sample. At the beginning of the test, the stress grows until it reaches the yield stress. As the increasing stress overcomes the yield stress, the sample begins to flow and the stress decreases to its steady-state value under flow. The peak value of the stress, sometimes called a stress overshoot, is taken to be the yield stress.
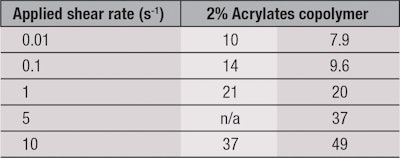
It is important to note, the yield stress obtained with the steady shear method depends on the shear rate applied. To illustrate this point, steady shear startup curves—performed at several different applied shear rates—are shown for the two test samples in Figure 3. The stress is plotted versus the strain, γ, where one strain unit is defined as the point where the rotating fixture has turned an angular displacement equivalent to the gap height, as illustrated earlier. Strain and time are related by the strain rate (see Equation 2). Static yield stress values obtained for each applied shear rate are shown in Table 2.
Creep Method
The creep method is perhaps the most accurate method, in principle, of determining the yield stress of a given sample. In a creep test, a constant stress is applied to the sample and the resulting compliance is measured. The compliance is given by Equation 3, where σ0 is the applied stress. The strain also can be monitored in place of the compliance.
In the creep method, a constant stress below the yield stress is applied to the sample and the resulting strain or compliance is measured until a steady state is reached. Another creep test is then performed at a slightly increased stress.
At applied stresses below the yield stress, the sample does not flow, but experiences elastic deformation, similar to stretching a rubber band. At applied stresses above the yield stress, the sample will flow and deform irreversibly. In both cases, elastic deformation and flow have distinctively different creep compliance curves. Thus, the yield stress can be found by determining the applied stress at which the sample response changes from elastic deformation to flow.
However, the primary drawback of the creep method is for stresses below the yield stress, the measurement can sometimes take a long time—on the order of several minutes to several hours or longer—to reach a steady state. As a rule of thumb, creep tests at low stress—where only elastic deformation is taking place—should reach a strain of around one, or 100%, to be considered at a steady state.
A series of creep tests with increasing applied stress is shown in Figure 4 for the two test materials. In these samples, elastic deformation appears as a compliance that is slowly increasing at an unsteady rate,9 whereas flow appears as a steady, linear increase in the creep compliance with time. Under steady flow conditions, the sample viscosity at an applied stress is the inverse slope of the linear portion of the creep compliance vs. the time curve for that stress.
For the sample shown in Figure 4a, the transition from elastic deformation to flow occurs between 7 Pa and 11 Pa; therefore, it can be stated the static yield stress for this sample is between 7 Pa and 11 Pa. Likewise, the static yield stress for the structured body wash in Figure 4b is between 1 Pa and 4 Pa. Further creep tests can be performed to narrow the range of the static yield stress. These experiments at low applied stresses were stopped after roughly four hours due to sample evaporation.
Amplitude Sweep
An amplitude sweep, i.e., strain or stress sweep, is an oscillatory test often performed to determine the linear viscoelastic region (LVR) in preparation for a frequency sweep. However, the yield stress can also be determined from an amplitude sweep. At a given frequency, either the stress or strain is increased and the elastic and viscous moduli, Gʹ and Gʹʹ, respectively, are measured. The elastic modulus Gʹ can be considered the amount of energy a material can store; conversely, the viscous modulus Gʹʹ is the amount of energy lost due to viscous dissipation.
When plotted versus strain or stress on a log-log plot, Gʹ and Gʹʹ generally behave in a similar manner for most materials possessing a yield stress (see Figure 5a). At low strain/stress, the deformation is not large enough to cause the material microstructure to yield, so Gʹ and Gʹʹ are constant with increasing strain/stress. As soon as the strain/stress reaches a magnitude large enough to cause the material microstructure to yield, Gʹ begins to decrease as the stress-bearing microstructure begins to break apart. Once the material has fully yielded, Gʹ and Gʹʹ both should decrease at constant rates.
Yielding is a gradual process for most viscoelastic materials. Gʹ does not decrease sharply and instantaneously, so what point in Figure 5a corresponds to the yield stress? Arguably, the yield stress could correspond to several different features of the curves shown. First, the linear regions of Gʹ at low and high stress can be fitted to straight lines, and the yield stress taken as the stress value at the intersection of these lines, i.e., the onset point method. This method interprets the yield stress as the breakdown of Gʹ.
A second interpretation takes the yield stress to be the point at which Gʹʹ becomes larger than Gʹ, i.e., the crossover method. From this interpretation, the yield stress is the stress at which the sample transitions from more solid-like to more liquid-like behavior. Yet another method interprets the yield stress as the maximum in elastic stress (see Equation 4), when σʹ is plotted versus the applied stress or strain. The elastic stress stored in the sample grows until the yield stress is reached, at which point the elastic stress begins to dissipate due to flow.
All of the above methods should give yield stress values that are practically equivalent for simple yield stress materials—and no one method is more valid than the others—as sound arguments can be made for all. However, for complex systems, some of the above methods can lead to ambiguous results.
For example, some materials show multiple shoulders in Gʹ as stress or strain is increased, indicating separate “yielding” events. For this case, the onset point will give an erroneous value for the yield stress and the elastic stress will show several local maxima. Thus, the crossover method is preferred to avoid ambiguity during data analysis.
Amplitude sweeps for the two test materials are shown in Figure 6. At a frequency of 0.1 rad/sec, the static yield stresses are 11 Pa and 6.5 Pa for the acrylates copolymer solution and body wash, respectively, found by the crossover method. Remember, for oscillatory tests, the frequency of oscillation is equivalent to the reciprocal of the timescale of observation. Thus, lower frequencies correspond to lower De and longer observation and deformation times.
Brookfield Yield Value
A simple yield stress measurement also exists for Brookfield viscometers. Measurements are performed at two rotational speeds and these two points are extrapolated to zero shear rate. The Brookfield yield value (BYV), expressed in Pascals, is given by Equation 5, where η2 is the viscosity at the lower speed, which is half of the larger speed. The BYV was measured here using an LV-4 spindle at 0.5 rpm and 1 rpm for the two test materials, and found to be 1.8 Pa and 1.5 Pa for the 2% solution of acrylates copolymer and structured body wash, respectively.
Summary of Yield Stress Values
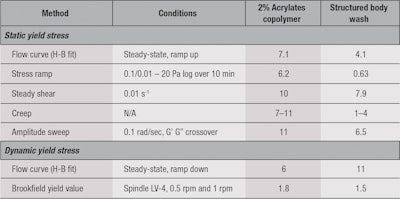
All the yield stress values measured for the two test materials using the methods described are listed in Table 3. The conditions for each experiment also are listed. The average static yield stress value obtained for the acrylates copolymer solution was 8.5 Pa, with a standard deviation of 2.2 Pa.
Likewise, the average static yield stress for the thixotropic structured body wash was 4.8 Pa, with a standard deviation of 3.0 Pa. For the dynamic yield stress, the BYV was in good agreement with the flow curve method for the thixotropic structured body wash, but not for the acrylates copolymer solution.
There also was variability in the measured yield stress values for both samples across methods—more significantly so for the thixotropic body wash, where the measured yield stress values range from 0.63 Pa to 7.9 Pa. This is a significant variation and likely due to the fact that yielding, for some materials, is a more gradual process and not so much a “step-change.” Indeed, the range of stress over which yielding occurs (see Figure 5a) is wider for the body wash compared with the acrylates copolymer solution (see Figure 6).
Each method listed above samples the entire yielding range, but the point at which the yield stress is assigned varies between the methods, which can lead to larger errors for samples yielding over wider ranges of stress. Thus, for such materials, it is recommended the yield stress be measured by several different methods while conducting repeats of each method.
A decision on the final reported value should then be made based on the quality of data from each method and reproducibility across methods. Nevertheless, these discrepancies further highlight the need to specify measurement protocols when quoting yield stress values and the need for consistency in measurement protocols when comparing yield stress values across different samples.
Conclusion
All methods discussed here have advantages and disadvantages in their practicality and ease of implementation—as well as their correlation with the “truest” yield stress value that can be measured. Some methods are more or less exact and some are more or less difficult to perform.
The goal of these articles is to inform the reader of these methods, provide guidance in implementing them and make recommendations based on exactness, ease of experimentation and robustness. In these terms, the amplitude sweep is most preferred, as it is quick to perform and analysis is often straightforward because no data-fitting is required.
Since sedimentation occurs at long timescales, it is more desirable to perform the amplitude sweep at lower frequencies—however, experiments at lower frequencies take longer to perform and sample evaporation can occur at long experimental times. Thus, frequencies between 0.1–1.0 rad/sec represent a good compromise between exactness and ease of experimentation. The yield value obtained from the amplitude sweep can be checked by other methods performed at similar timescales.
To summarize, several methods to measure yield stress have been outlined to determine the best in terms of relevance, exactness and robustness. Thus, in conjunction with part one of this article, a complete protocol to evaluate samples for yield stress determination can be outlined as follows.
- Determine the type of yield stress required for the application (static vs. dynamic).
- Determine if the sample has a yield stress at the timescale of interest.
- Long timescales: tan(δ) < 1 as ω→0.
- Shorter timescales: tan(δ) < 1 at timescale of interest.
- If the sample has a yield stress, determine how much yield is needed (see Part I, Equation 8).
- Measure the yield stress.
- The amplitude sweep, crossover method is preferred.
- The steady shear and flow curve methods are preferred next, if needed.
- Check the measured value against other methods, if needed.
- Include the method(s) and parameters used when quoting and presenting yield stress values.
Using these procedures, one can properly determine if any sample possesses a yield stress at a timescale of interest and safely estimate how much yield is required for an application. It is important to the success of a product to be able to perform these calculations and measurements accurately because the formulator can then create a product in the most efficient manner, without guessing the amount of suspending agent needed for a given application.
Thus the amount of yield will always be optimal and the formulator can have more freedom to create a product with a more desirable texture, viscosity and overall rheological profile.
Acknowledgements: The author would like to acknowledge Thomas Hu for input, and Don Harper, Tobias Fütterer and Michael Fevola for general feedback and proofreading.
References
- GWS Blair, On the nature of “yield-value,” J Applied Physics 4 (1933)
- RG Larson, Constitutive equations for thixotropic fluids, J Rheology 59 (2015)
- PCF Moller, J Mewis and D Bonn, Yield stress and thixotropy: On the difficulty of measuring yield stresses in practice, Soft Matter 2 274–283 (2006)
- J Mewis and NJ Wagner, Thixotropy, Adv in Colloid and Interface Sci 147–48 214–227 (2009)
- MM Denn and D Bonn, Issues in the flow of yield-stress liquids, Rheologica Acta 50 307–315 (2011)
- S Ozkan, TW Gillece, L Senak and DJ Moore, Characterization of yield stress and slip behavior of skin/hair care gels using steady flow and LAOS measurements and their correlation with sensorial attributes, Intl J Cos Sci 34 193-201 (2012)
- HA Barnes, A Handbook of Elementary Rheology, The University of Wales Institute of Non-Newtonian Fluid Mechanics, Aberystwyth (2000)
- S Spagnolie, ed, Complex Fluids in Biological Systems, Springer, New York (2015)
- P Moller, A Fall, V Chikkadi, D Derks and D Bonn, An attempt to categorize yield stress fluid behavior, Philosophical Transactions of the Royal Society A—Mathematical Physical and Engineering Sciences 367 5139–5155 (2009)
