Today, more and more consumers are concerned about the harmful effects of the sun, particularly the risks of UV exposure. Indeed, excessive UV exposure causes sunburn, which is the body’s signal to limit exposure and may also be responsible for undesirable effects such as premature skin aging, skin cancer and other damage.
While the most effective protection is to reduce UV exposure altogether, this is not a global solution. Humans need some UV exposure—the devil is in the dose. Sometimes UV exposure is excessive due our way of life, as people often rush out to enjoy warmer summer weather and get a tan. Fortunately, there is a general trend for using appropriate protective and preventative measures thanks to increasing global awareness campaigns about sun protection. To this end, the best options are fabrics to block UV exposure and sun care products.
Concerning the latter, sunscreens with the well-known sun protection factor (SPF) for UVB (290 nm to 320 nm) are used. Emphasis on UVA protection (320 nm to 400 nm) also has increased, in conjunction with maintaining overall broad spectrum activity. Furthermore, consumers now require traditional sun protection with improved esthetics and added benefits including water resistance and other resistance factors.
Following this need, the present authors sought to develop a new in vitro UV test to reliably determine the rub resistance of sun care products. The resulting Rub Resistance Factor indicates whether a sunscreen is still effective after being rubbed with a textile.1 For example, if users dry themselves with a towel or apply clothing, it is worth evaluating whether the sunscreen they applied still provides enough protection. This new in vitro test is also marketable, and provides a strong label claim for sunscreen manufacturers to make on sun care products.
Twenty sun care products and several textiles and conditions were tested in the present study. The method and results obtained are described herein.
Materials and Methods
Sun care products: As noted, for this study, twenty commercial sunscreens marketed by different companies were tested. The products had different textures and provided varying levels of protection ranging from SPF 6 to 50+, per the 2006 European Recommendation on sunscreen claims.2
Substrate selection: The roughness of test substrates has been shown to affect the reproducibility of UV in vitro tests.3-5 Thus, molded polymethyl methacrylate (PMMA) platesa were used for the present study. The application area measured 47 mm x 47 mm, i.e., more than 22 cm², and only one face of the plates was rough. All surface topography parameters were controlled with an ad hoc profilometer and were in total compliance with the specifications described in the ISO 24443:2012 standard for in vitro UVA-PF determination.6
Sunscreen application: Sunscreens were shaken to assure good homogenization, then applied to the PMMA substrates at a rate of 1.3 mg/cm² in nine areas using a 1-mL syringe. Immediately following, the sunscreen was spread using an automated device.
Automated spreading: The automated spreading deviceb used is composed of two parts. The first is a robotic arm, which performs precise and repeatable movements—particularly circular and linear strokes with controlled pressure. The second part is a tool with a hard surface that simulates the human finger. This combination perfectly imitates human spreading with better reproducibility, as was previously demonstrated.7 After spreading, samples were allowed to dry and settle for 15 min, during which the temperature of surface substrates and products were maintainedc at 25°C ± 2.0°C.8
Textile selection: Fabric generally is conditioned at least 24 hr before analysis in a metrology laboratory. Here, the fabric was acclimated to and testing was conducted at a temperature of 20°C ± 2°C and 65% ± 4% relative humidity, per ISO 139:2005. Textile features were assessed, including: any shrinkage; the mass per unit length of twists in the threads; the number of horizontal and vertical threads per centimeter, i.e., warp/weft fill for fabric, or row/column for knitting; the fabric weight; the weave of the fabric; and the thickness of the fabric.
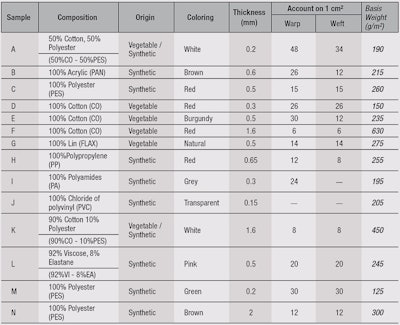
In this study, 14 different textiles were used. Features such as composition, thickness, basis weight and account warp/weft are described in Table 1. To determine a sunscreen’s rub resistance, it was important to test different textiles to set the parameters of the method and select the best textile to use.
Automated textile rubbing: A part was previously developed by means of a 3D printer (see Figure 1), which for the present study was fixed onto the robotic arm of the automated spreader in place of the finger simulator tool (see Figure 2). It was used to perform reproducible, circular movements on the surface substrates to imitate the rubbing of clothes or a towel on the samples.
Based on the same principle as the in vitro and in vivo sunscreen tests, before performing the real rubbing test, the textile was presaturated with the sunscreen product being tested. Indeed, the presaturation step reduces the cream absorption by the textile, leading to better reproducibility. During the automated textile rubbing, the pressure, speed and time were predefined and controlled by the robot software.
Transmittance measurements: The evaluation of sun care product absorbance was performed using a spectrophotometerd. Before measurements, the transmittance analyzer was calibrated according to the ISO 24443:2012 Annex A by wavelength accuracy linearity and dynamic test, using a calibrated reference standarde to which UV filters were added. Furthermore, blank transmissions were created using PMMA plates covered with glycerin.
Measurements of the test samples were taken in the UVA and UVB wavelength range, from 290 nm to 400 nm, in 1-nm increments. Transmittance measurements were repeated before and after the automated textile rubbing, to compare the impact of rubbing on the products.
Rub Resistance Calculations
Before calculating a sunscreen’s RRF, it is important to calculate the in vitro SPFi—i.e., the individual SPF for each plate to which product is applied. For each test and sunscreen, three plate replicates were used. Thanks to the combination of UV light attenuation by the sunscreen, plus the erythema action spectrum, plus the relevant solar emission spectrum, it is possible to calculate the in vitro SPFi according to Equation 1.9
Here, E(λ) is the relative effectiveness of UVR in producing erythema in human skin according to the erythema action spectrum (CIE-1987) at wavelength λ; I(λ) is the spectral irradiance received from the UV source at wavelength λ in midday, midsummer global irradiance at 40°N (W•m-2•nm-1); d(λ) is the wavelength step, equal to 1 nm in this study; and A(λ) is the monochromatic absorbance of the sunscreen layer at wavelength λ, where A(λ) = –log[T(λ)].
Rub resistance rationale: Here it is important to consider two principal ways for claiming a product is rub resistant. These are based on the rationale for the official water resistance claim.10-12 First, one can simply label the SPF after rub resistance tests are performed. Alternatively, a product can be considered rub resistant (%Rub) if the value for the 90% lower unilateral confidence limit of SPF after rubbing is greater than or equal to 50% of SPF before rubbing. This second option was used for the present study, since it is assumed to be more reliable than an absolute value for expressing such a property. Sometimes, the %Rub value exceeded 100.0% due to a better repartition of the product over the substrate during the textile rubbing. Consequently, the SPF after rubbing could be higher than before rubbing. In this case, the %Rub value retained was 100.0% and SPF value noted as being superior.
Thus, the in vitro SPFi was calculated before and after rubbing to determine the individual percentage of rub resistance (%Rubi) for each individual substrate according to Equation 2.
The percentage of rub resistance retention (%Rub) can be expressed as the arithmetic mean of the n individual %Rubi values (mean %Rubi), minus the 90% unilateral confidence interval for the mean %Rub (expressed by d). This is shown in Equation 3.
Further, Equation 4 shows the calculation for d.
Here, tu is the t value from the “one-sided” student’s t distribution table at a probability level p = 0.10, with n-1 degrees of freedom; s is the standard deviation; and n is the total number of measurements in the test—equal to three replicates, in this case.
The coefficient of variation (%CV) or relative standard deviation of the analytical results also is calculated to compare the dispersion or variation in groups of measurements. This is expressed by the ratio of the standard deviation, s, to the mean %Rubi and multiplied by 100 to convert it to a percentage of the average (see Equation 5). Although the acceptance criteria may be widened in some instances, in this case, the acceptable precision was 20%.
Parameters Influencing Rubbing
To determinate the Rub Resistance Factor of a sunscreen, analyses of the parameters influencing the automated textile rubbing were performed. Twenty sunscreen products were tested using two different pressures, two different speeds and for two different durations using the same textile, D, to establish the optimum test conditions.
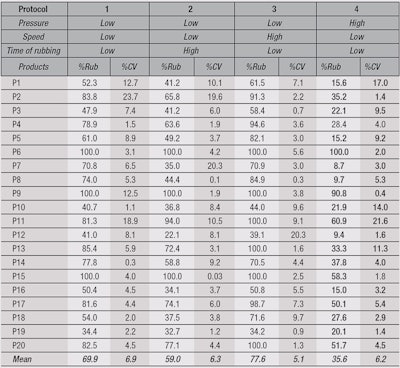
For dermal safety, we assumed to mimic the pressure used during self-drying with a towel. This led to an estimation of 4N ± 1N, where N refers to Newtons. Therefore, in this study, the low pressure was 4N ± 1N and the high pressure, 8N ± 1N. The low speed was equal to 0.03 m/s and the high speed, 0.08 m/s; and the low/shorter rubbing time was 1 min; the high/longer, 2 min. Table 2 and Figure 3 represent the mean %Rub and %CV for all products according to Low and High parameters.
Pressure: The first parameter tested was pressure. The other parameters, i.e., textile, speed and rubbing duration, were fixed. Figure 3 shows a clear decrease in the mean percentage of rub resistance when the pressure was high. This matches the hypothesis that a textile in more contact with the sunscreen leads to less rub resistant sunscreen. Furthermore, in the Table 2, the mean percentage of rub resistance for all products nearly doubled with low pressure compared to high pressure; respectively a mean %Rub equal to 69.9% and 35.6%.
Moreover, sixteen products were considered rub resistant with the low pressure whereas only six were with the high pressure. These results show the importance of pressure during the automated textile rubbing. Since the high pressure test was too selective, low pressure was chosen to perform rub resistance tests.
Duration: The second parameter was rubbing duration, and as in the previous test, the other parameters were fixed. As shown in Figure 3, a slight decrease in rub resistance of almost 10% was observed with longer rubbing duration. However, according to Table 2, ten sun care products were considered rub resistant with the higher rubbing time, whereas sixteen products were with the lower rubbing time.
In this case, the differences were more significant. Also, the results showed the importance of rubbing duration. Since the lower rubbing time was less selective, the higher rubbing time was used for the rub resistance testing.
Speed: The last parameter analyzed was speed. Once again, the other parameters were fixed. As shown in the Table 2, the mean percentage of rub resistance with low speed was similar to the mean for high speed; respectively 69.9% and 77.6%. Furthermore, sixteen products were considered rub resistant when the rubbing speed was low or slow, compared with seventeen products with the high or fast speed. This slight difference between the two is well-illustrated in Figure 3. Thus, the slow rubbing speed was chosen in accordance with all conditions, i.e., low pressure and high rubbing time.
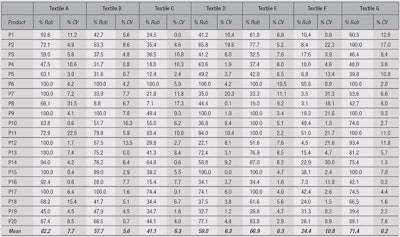
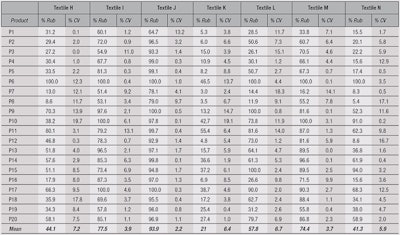
Textiles: Beyond pressure, time and speed, different textiles were tested. For this purpose, the 20 products were tested using 14 textiles (see Table 1) according the determined conditions—i.e., low pressure, low speed and high rubbing duration. Based on these results, shown in Table 3a and Table 3b, the best textile for the new rub resistance in vitro test was chosen based on three criteria.
First, the textile must exhibit a significant degree of selectivity; i.e. the percentage of products deemed rub resistant should be between 50% and 70%. Second, the textile should have standardized features such as a composition with only one or two components. For this purpose, it was important to analyze the influence of textile features, i.e., composition, thickness, weight and netting, on the percentage of rub resistance. Finally, the results yielded must be repeatable and reproducible under the other set conditions.
Textile Composition and Traits
Based on the first criterion to determine the best textile for the rub resistance test, i.e., a mean %Rub between 50% and 70%, it was interesting to demonstrate that the textile really is important. Indeed, as shown in Figure 4, great variability in the %Rub between different textiles with different compositions was observed.
For example, textile A, made from 50% cotton (CO) and 50% polyester (PES), and textile K, comprising 90%CO and 10%PES, had mean %Rub values of ~82.2% and ~21.0%, respectively. Moreover, even with the same composition, different %Rub can be obtained. This was the case with the 100% CO composition of textiles E and F, which respectively had a mean %Rub of about 66.9% and 24.4%.
Thus, it was difficult to identify whether one component was better than another, since several compositions (textiles B, D, E and L) gave a %Rub between 50% and 70%. These were composed of cotton, polyester and a mix of viscose and elastane. The other compositions, however, were too selective or not selective enough for this test. The authors therefore concluded the textile composition selected for important for the test, but showed no general trend. Beyond composition, however, other features of the textile were deemed important.
Thickness and weight influence: First, the relationship between %Rub and textile thickness or basis weight were analyzed; these are shown, respectively, in the graphs of Figure 5 and Figure 6. Although a continuous decrease in rub resistance was observed, depending on the thickness or basis weight parameter, the %Rub seemed to reach a minimum level and remain almost constant over the maximum respective feature. This observation could be explained by the logic that when the textile is thicker or has a higher basis weight, the intensity of the contact is higher and thus more susceptible to the removal of sunscreens from the substrates.
A nonlinear relationship according to a logarithmic regression function provided a good fit with the data, with a coefficient of correlation r = 0.892 for thickness and r = 0.832 for the basis weight. These indicate that thickness and basis weight of the chosen textile have a real influence on the mean percentage of rub resistance.
To conclude, based on the first criterion to determine the best textile for the test, the textile selected should have a thickness between 0.30 mm and 0.70 mm, and a basis weight 170 g/m² and 290 g/m²—which was the case for textiles B, C, E, G, H, I and L.
Total warp and weft influence: Second, the relationship between %Rub and the total account of warp and weft, or horizontal and vertical lines of threads, is visualized by the curve in Figure 7. Contrary to previous results, an increase in the %Rub was observed proportional to the total account of warp and weft. Also, as before, a nonlinear relationship according to a logarithmic regression function provided a good fit with the data, with a coefficient of correlation r = 0.887.
Moreover, to obtain a mean of the percentage of rub resistance between 50% and 70%, the value of the warp and weft had to fall between 30 and 55. Few textiles tested fell within this range, as it was only the case for B, C, D, E and L.
At the end of this study on the influence of textiles on rubbing, the fabrics selected were B, E and L, as they fulfilled all the conditions—composition, thickness, basis weight and netting. In addition, they fell within the range of %Rub 50–70%. Nevertheless, the percentage obtained was very close to 50% for textiles B and L, and due to the variability of the test, the results could be challenged. To conclude, textile E was the best option as it presented a good mean rub resistance percentage for the twenty products tested, with an average of 66.9%.
SPF Results of the Final Protocol
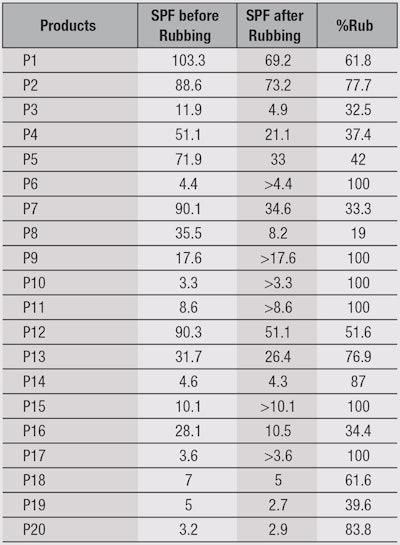
According to the previous observations and results, the same testing conditions of low pressure and speed, higher rubbing time and use of textile E were followed. The SPF before and after rubbing and the %Rub are shown in Table 4.
Repeatability and Reproducibility
After determining the parameters influencing the automated textile rubbing and the best textile for the tests, i.e., low pressure, high rubbing duration, low speed and textile E, the repeatability and reproducibility of the final method were evaluated. This way, the test would prove reliable so that any operators and laboratories could perform it and obtain the same results using the same key parameters.
To begin, the repeatability of the final method was checked by observing the results collected in Table 3a and Table 3b. Unambiguously, the mean %CV being less than 10%, and the maximum %CV being less than 15%—excluding the P6 result, whose %Rub was more than 100%—conclude that the test is repeatable. It also confirms, again, that textile E is the best choice for rubbing.
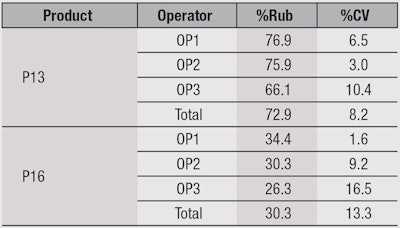
In addition, in order to check the reproducibility of the final test method, two different products, one showing rub resistance and the other not, were tested three times under the same conditions previously selected but according to different operators. The results of each individual test and total %Rub including %CV between operators are shown in Table 5.
With three different operators performing this test, the %Rub claim was the same for both products selected, and the total %CV inter-operator was approximately 10-15%, indicating good reproducibility.
To conclude, the test could be considered reproducible because the equipment used during the application, which is frequently calibrated, and the spreading and rubbing of sunscreens were standardized and performed using the automated robot.
Conclusion
Thanks to this study, the reliability of a new in vitro test to assess the rub resistance of sun care products has been demonstrated. All the parameters were studied, particularly during the automated spreading and textile rubbing, and the different test conditions were selected according to the results obtained for the different analyses. Conditions included: low pressure (4N ± 1N), low/slow speed at 0.03 m/s and high/longer rubbing time of 2 min. Furthermore, the textile selected respects all the parameters to obtain a good degree of selectivity for the test. The textile chosen was E, composed of 100% cotton, having a thickness between 0.30 mm and 0.70 mm, a basis weight between 170 and 290 g/m², and a total warp and weft between 30 and 55.
Furthermore, this study shows the new in vitro method is repeatable and reproducible, with respectively a mean coefficient of variation less than 10% between the different products tested, and less than 15% according to different operators. To conclude, any testing laboratories and technicians could perform this test and obtain the same results if the testing conditions are strictly respected.
Finally, in addition to being reliable, the approach is especially innovative in that the devices used are automated and no other known laboratories have proposed this type of in vitro test. Furthermore, the assessment of rub resistance is a major asset for consumers and manufacturers. Indeed, informing consumers that a product is rub resistant adds value because consumers want products that are more and more efficient.
References
- RP Stokes and BL Diffey, Intl J Cos Sci 22 329-334 (2000)
- https://eur-lex.europa.eu/legal-content/EN/TXT/PDF/?uri=CELEX:32006H0647&from=EN (Accessed February 2015)
- L Ferrero, M Pissavini, A Dehais, S Marguerie and L Zastrow, IFSCC 9(2) 1-13 (Apr/Jun 2006)
- M Pissavini, S Marguerie, A Dehais, L Ferrero and L Zastrow, Cosm & Toil 124(9) 56-64 (Sep 2009)
- S Miksa, D Lutz and C Guy, Cosm & Toil 129(3) 30 (Apr 2014)
- ISO 24443, ISO/FDIS 24443 2011(E) (2011)
- S Miksa, D Lutz and C Guy, Cosm & Toil 128(10) (Oct 2013)
- S Miksa, D Lutz and C Guy, Cosm & Toil 128(7) 484-494 (Jul 2013)
- BL Diffey and J Robson, J Cos Sci 40 127–133 (1989)
- www.gpo.gov/fdsys/pkg/FR-2011-06-17/pdf/2011-14766.pdf (Accessed Mar 10, 2016)
- http://ris.dpmc.gov.au/2012/11/16/australian-and-new-zealand-sunscreen-standard-asnzs-26042012-%E2%80%93-regulation-impact-statement-%E2%80%93-department-of-health-and-ageing/ (Accessed Mar 10, 2016)
- https://cosmeticseurope.eu/publications-cosmetics-europe-association/guidelines.html?view=item&id=18 (Accessed Mar 10, 2016)
