In vitro testing for the determination of sun protection is essential for the cosmetics industry. It is fast, relatively inexpensive, and can be used routinely. However, until 2006, only in vivo methods were subject to recommendations or regulations. Since then, organizations such as the Agence Française de Securité Sanitaire des Produits de Santé (AFSSAPS), Colipa and the International Organization for Standardization (ISO) have proposed the development of in vitro methods to replace in vivo methods.
Standard in vitro tests are based on diffuse transmission spectroscopy, wherein a thin film of sunscreen is applied to a suitable UV-transparent substrate, then UV radiation is transmitted through the film and measured by a spectrophotometer equipped with an integrating sphere. Several authors have used the SPF in vitro method and shown a fair correlation with in vivo values;1-4 however, controversy surrounding the results underlines a weakness in the existing in vitro method: a lack of control over the parameters that influence the results. Interestingly, better correlations were obtained when strict control was exercised over variables including the validation equipment and amount of product used, as well as its evenness of application.5-8 Among these important variables is the roughness of the test substrate, which until now, had not yet been fully detailed.
Indeed, the recent Colipa method for in vitro determination of UVA protection9 or DIN 6750210 characterizes the substrate but only by its percentage of transmission at
290 nm, 300 nm and 320 nm, and by the arithmetic average of the surface, Sa. It has been shown11 that the roughness of the test substrate has a major impact on the test results and influences the reproducibility and repeatability of the measurements. Therefore, in the present work, the authors investigate this parameter by comparing standard vs. molded poly(methyl methacrylate) (PMMA) substrates to improve the reproducibility of in vitro SPF test results.
Materials and Methods
Roughness of substrate: To determine the roughness of the tested substrates, a 10 mm x 5 mm area on each type was measured at 15-µm intervals at a scanning speed of 100 steps/sec. This non-contact surface topographic analysis was conducted using a lab work stationa consisting of an optical sensor, a motion controller, an x-y translation stage, and microtopography softwareb. The confocal optical sensor is based on a white light chromatic aberration principle, which allows for a high resolution: 10 nm vertically and 1 μm horizontally.
Surface topography parameters: Per Colipa’s recommendation, the arithmetic average Sa was employed for this study. Surface topography parameters were calculated by the arithmetic average of the surface (Sa, Sv, Sdq) or by the mean of the different profiles (Ra, Rv, Rdq) analyzed (see Topography Parameters). While these calculations are different, both describe the same roughness characteristic.
Substrate for in vitro spectroscopy: Two types of PMMA plates (Sa =
6 µm) were used for the present study. First, two batches of a standard type of plate roughened on one face by silica beads were developed and compared. Here, these will be referred to as the standard and new batches. These plates measured 50 x 50 x 3.0 mmc. Such sandblasted plates have been used for some time in Europe.7 Then, a second, molded type of plate measuring 47 x 47 x 1.5 mmd was developed and compared with the first type.
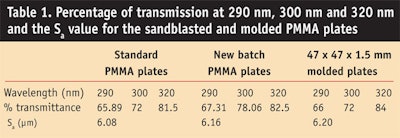
Optical transmission guidelines: According to Colipa guidelines, the minimum average optical transmission requirement through a substrate treated with glycerin or ethanol is 60% at
290 nm, 69% at 300 nm, and 81% at\320 nm. The present study was controlled with respect to these recommendations. The roughness and optical characteristics for each type are shown in Table 1.
In vitro spectroscopy conditions: A transmittance analyzere was used to test sandblasted PMMA plates covered with a film of solvent (glycerol) to obtain the blank transmittance, from 290 nm to 400 nm.
Application rate: Preliminary studies found the application rate of 1.2 mg/cm2 for the sandblasted PMMA plates (Sa = 6 µm) to be the most reproducible and to provide the best correlation within vivo results. Concerning the molded plates, a large number of assays revealed that the application rate was optimized when the rate was slightly increased to 1.3 mg/cm².
To ensure a correct application rate, the sampling pipette was weighed before and after application of the product. Immediately after weighing (within 30 sec), the sunscreen product was spread over the entire surface of the substrate using light strokes. The sample obtained was then allowed to settle on the substrate for 15 min in the dark at room temperature to ensure self-leveling of the formula. A total of 9 UV transmission spectra—from 290 nm to 400 nm, in 1 nm increments—were recorded on each plate at a different location. Three different plates were used for each roughness class to provide an average of the UV transmission data at each wavelength.
Sunscreen sample: The sunscreen product used in the study was an o/w emulsion based on behenic emulsifier. The filters incorporated were: 6% ethylhexylmethoxycinnamate, 2% ethylhexyl triazone, 4% ethylhexyl salicilate, 3% BMDBM, 3% BEMT, and 3% MBBT.
Results and Discussion
Since the current in vitro method to determine the SPF of a sunscreen product typically utilizes a sandblasted PMMA substrate (Sa = 6 µm roughness), the authors first investigated the reproducibility of results on two different batches of sandblasted PMMA substrates (i.e., the standard and new batches). This was accomplished by measuring the SPF of the sample sunscreen described above.
The transparency of the PMMA plates matched Colipa guidelines as set forth and the roughness parameter, Sa, was verified for each batch using a broad field confocal sensor; the plates selected had an Sa value = 6 + 0.5 µm. The authors measured the SPF of the sample sunscreen on the standard and new batches of plates; since the plates were checked, reproducible SPF values should be obtained (see Table 2).
Note that in the present study,
in vitro SPF methods are not used as references, although previous publications7-8 have shown their efficiency and recommended them; they are the most relevant tool to compare the results of UV indices between different sets of substrates, following a standard and controlled deposit protocol.
The first series of results from the sandblasted plates (i.e., the standard batch) yielded an SPF of 33, which is in line with the in vivo value. However, the second series of results, obtained with the same protocol and operators from the second batch of sandblasted plates (i.e., the new batch), produced an SPF of 49, which is not in line with the expected value.
Discussion
It is therefore necessary to more deeply characterize the surface roughness of the substrate. While Sa remains useful as a general guideline to characterize surface texture, it proves to be too general to describe the functional nature of the substrate surface. A surface with sharp spikes, deep pits or general isotropy may all yield the same average roughness value, and Sa makes no distinction between peaks and valleys, nor does it provide information about spatial structure.12
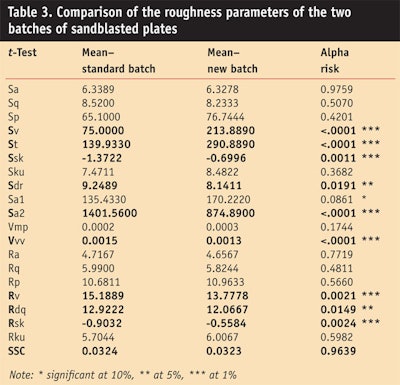
The authors thus screened 20 of the main roughness parameters in two and three dimensions from all the standard plates tested above and compared them with measurements taken of plates in the new batch. In the case of equal variances, the student’s t-test was employed and in other cases, the Welch W-test was used (after checking of the normality of the series). Of the 20 roughness parameters studied, 7 presented significant differences at a threshold of at least 1% risk (see Table 3). The alpha risk indicates the risk to be wrong, thus concluding that a difference exists.
The variability of the SPF measured in vitro, obtained with the same protocol and operators, and the difference in topography of the 2 batches despite their common Sa value can be explained by specific roughness parameters. The deepest valley (Sv) of the standard batch is less deep than the new batch. Also, the total height of the standard profile (St) is weaker than the total height of the new batch profile. The St being less high could be linked to the absence of two important peaks caused by the wear of the plates during transport and the mechanical action of vibrations causing friction between the plates. The standard batch also offers more product storage space in its valleys than the new batch (Sa2std > Sa2nb), as the schematic in Figure 1 shows.
Since the valleys of the standard batch are less deep than the valleys of the new batch (Ststd < Stnb), one can deduce from the Vvvstd > Vvvnb that the valleys of the standard batch are broader and/or more numerous than the new batch. As noted, the Sa value is the same for each batch but the St and Sv are very different. This is only possible if the deeper valleys of the new batch are fewer than those of the standard batch, so that their variations in depth are unnoticed in comparison with the average.
These roughness variations observed on the new batch, and subsequently in 3 other batches, show that the Sa parameter is not sufficient to obtain reproducible SPF values that are in line with the in vivo SPF value. However, the 10 parameters shown in Table 4 do allow for the precise characterization of the substrate roughness.
Optimal Roughness Characteristics
Since these parameters reduce all of the information in a substrate profile to a single number, great care must be taken in applying and interpreting them. Small changes in how the raw profile data is filtered, how the mean line is calculated, and the physics of the measurement can greatly affect the calculated parameter. Taking into account that 3D roughness parameters are known to be sensitive to experimental conditions (due to filtering requirements), normalized 2D parameters are preferred.
The optimal parameters chosen for this study included the following:
Ra: Colipa recommendation
Rp: preferred to Sp
Rv: preferred to Sv
Rdq: root mean square gradient
Rsk: preferred to Ssk
Rku: associated with Rsk to be in accordance with the Abott Firestone curve
Vvv: volume of void in the valleys
A1: to replace Sa1: equivalent triangle area for peaks: volume of running in scraps. A1 defines the volume of peaks likely to disappear during engine running in.
A2: to replace Sa2: equivalent triangle area for pits: volume of oil reserve. A2 defines the oil volume that the surface can store for lubrication during running.
Sdr: suppressed (without 2D equivalent parameter)
Ssc: mean summit curvature: this parameter determines the average shape of summits, either sharp or rounded, from the average value of surface curvature at these locations St: suppressed 3D factor
To follow the quality of the different batches of PMMA plates, a control chart was developed based on previous results. One aspect of the chart represents the mean of at least 5 plates, comparing them for conformity; another aspect is based on ranges and checks the batch for homogeneity, according to benchmarks previously defined. This statistical follow-up on the roughness of several batches emphasized the vast heterogeneity of sandblasted plates (see Table 4).
This control chart can be used on batches of substrates to assist in the selection of conforming samples according to roughness to avoid deviations (i.e., drift or shift) in test results for in vitro UV indices. However, due to variability within batches of sandblasted plates, it remains difficult to ensure conformity. Even in the case of suitable sampling, the substrates chosen could be questioned. Taking this into account, the authors examined molded substrates derived from a new industrial process13 to determine whether they could provide better control over substrate roughness.
Molded PMMA Substrate
As noted, a new, molded type of substrated based on PMMA was examined since molds typically are able to maintain their shape and thus the “memory” of the desired roughness parameters. These plates were developed to offer a specifically adapted substrate with precise specifications. The substrates were manufactured via mold injection for assured reproducibility. Their design was based on the topographical data collected from the 6-µm (Sa) sandblasted PMMA plates so that their results correlated with UVA and UVB protection values obtained from the existing plates. The roughness parameters followed those set forth in the control chart.
As shown in Table 5, a decisive improvement was observed using the molded plates with the same control chart; all the roughness parameters exhibited a drastic % reduction in coefficient of variation (CV). Internal studies as well as several recent proprietary Ring Tests have shown how the reproducibility of the roughness profiles impact the determination of UV indices, significantly decreasing the CV on all results.
For example, as shown in Figure 2, the in vitro SPF value evaluated on both the sandblasted and molded plates using strictly the same deposit protocol (on several plates), revealed the benefits of roughness homogeneity to reduce resulting test variances. According recent investigations on standard UV indices, this improvement could be from 2% to 20%, in terms of CV%.
The authors then updated the control charts using a new set of target, lower and upper warning limits (LWL and UWL), where LWL and UWL were assumed to include approximately 95% of means, according to the normal distribution hypothesis; and lower and upper control limits (LCL and UCL) were assumed to include approximately 99.7% of means, according to the normal distribution hypothesis, in accordance with the stability of molded plates (see Table 6).
To maintain the consistent manufacture of the substrates, the authors reference the Western electric rules to detect non-random conditions. These rules state that one must test for special causes if two of three points in a row are beyond a warning limit. Or, if one roughness parameter beyond the control test limit is considered a major problem, then the batch must be refused.
Overall Variability Improvement
To investigate the overall improvement in variability of molded versus sandblasted substrates in a qualitative way, a Principal Component Analysis (PCA) was performed; the results are shown in Figure 3. On the X axis, PC1 = 44.51%, mainly supported by Ssc, Ra, Rsk, and A1 parameters; and on the Y axis, PC2 = 39.44%, mainly supported by A2, Vvv, and Rv.
The sandblasted plates, depicted by squares, are widely distributed, which indicates large inconsistencies in well-represented variables (considering the whole set of roughness parameters). In contrast, the molded plates, depicted as circles, are strongly concentrated in one area, indicating better homogeneity and similarity between plates. After these analyses the authors could conclude, on a broader scale, an overall improvement in roughness and dependent characteristics based on the use of molded PMMA plates.
Further, to account for the contribution of the whole set of roughness parameters to indicate plate quality, the authors used the z-score approach as a global indicator to validate the plate batches. With a z-score, any individual parameter value is transformed into its distance from the benchmark value (target) and expressed as a numerical standard deviation. Then, all individual z-scores were aggregated in a global z-score and found to provide an acceptable confidence interval (95% or 99.7%).
Conclusions
Until now, in vitro test methods to measure sun protection have held a disadvantage due to their failure in controlling parameters that influence the results, unlike the in vivo method. Although parameters such as the amount of product applied, the spreading process, and equipment validation have already been identified as factors implicated in the spectroscopic results, little attention has been attributed to controlling the roughness of the substrate used for in vitro methods.
In the present study, the authors clearly demonstrated the insufficent capacity of the Sa parameter to characterize the surface of the substrate. Indeed, the same product applied on two different batches of sandblasted plates, having the same Sa value, led to significantly different SPF results. For this reason, the authors statistically compared 20 parameters in 2 different batches of sandblasted PMMA plates to determine the parameters involved in variations in SPF values. They then established a control chart outlining the 10 most pertinent parameters showing significant differences. This chart led to the authors’ ability to obtain reproducible in vitro SPF test results.
Following this work, the authors performed similar studies on a new, molded type of PMMA plate and found this type of substrate to provide controllable, repeatable roughness parameters. Using the same control chart, the authors validated the molded PMMA plates, which led to consistent substrates and reproducible in vitro SPF test results. Finally, the z-score described here validated the substrates as well as product batches.
Moving forward, the authors expect to extend this investigation to adjust for the weight of each parameter (weighted z-score) to more accurately consider the effects of each on the SPF value. This validation will be adjusted according to new investigations on the relationship between roughness parameters and SPF values. The 10 parameters selected here were selected statistically but it is possible that some are redundant or have more or less influence on the SPF. Further investigations will allow the authors to weigh these roughness parameters and perhaps explain their individual importance on the SPF.
Acknowledgements
The authors wish to thank Olivier Brack of the K.S.I.C. Statistique Industrielle, in Cergy Pontoise Cedex, France, for his excellent support in the preparation of this publication.
References
1. K Kelley and P Laskar, In vitro protection factor evaluation of sunscreen products, J Soc Chem 44,139–151 (1993)
2. A Springsteen and R Yurek, In vitro measurment of sun protection factor of sunscreens by diffuse transmittance, Analytica Chimica acta (380) 2 155–164 (1999)
3. E Dutra and D Oliveira, Determination of Sun Protection Factor (SPF) of sunscreens by UV spectroscopy, RBCF (40) 3 (2004)
4. H Bendova and J Akrman, In vitro approaches to evaluation of sun protection factor, J Toxicology In vitro 21(7) 1268–75 (2007)
5. J Ferguson and M Brown, Determination of sun protection factors. Correlation between in vivo human studies and an in vitro skin cast method, Int J Cosm Science 10, 117–129 (1988)
6. B Diffey and JJ Robson, A new substrate to measure sunscreen protection factor throughout the ultravioletspectrum, J Soc Chem 40, 127–33 (1989)
7. M Pissavini and V Alard, Determination of the In Vitro SPF, Cosm & Toil 118 63 (Oct 2003)
8. U Heinrich and D Kockott, Comparison of sun protection factors determined by an in vivo and different in vitro methodologies: A study with 58 different commercially available sunscreen products Int J Cosmet Sci 26(2), 79–89 (2004)
9. The Colipa In vitro Photoprotection Methods Task Force, Method for in vitro Determination of UVA protection, Colipa Web site, available at www.colipa.eu/publications.html?Itemid=71&task=viewprod&id=33&catid=2 (2007) (Accessed Jul 13, 2009)
10. DIN Web site, Characterization of UVA protection of dermal suncare products by measuring the transmittance with regard to the sun protection factor, available at www.fnl.din.de/cmd?artid=75883296&contextid=fnl&bcrumblevel=1&subcommitteeid=54753688&level=tpl-art-detailansicht&committeeid=54738975&languageid=en (Accessed Jul 2, 2009)
11. L Ferrero, M Pissavini, A Dehais, S Marguerie and L Zastrow, Importance of substrate roughness for in vitro sun protection assessment, IFSCC 9 2 (2006)
12. M Zecchino, Characterizing surface quality: Why average roughness is not enough, available at: www.veeco.com/pdfs/appnotes/an511_roughness_64.pdf (accessed Jul 2, 2009)
13. Patent: FR 07-08972.
