Between 40 and 50 million Americans battle acne vulgaris. As long ago as 2001, expenditure on this condition exceeded $1 billion. For one popular over-the-counter (OTC) acne treatment alone, revenues for 2010 were projected to exceed $800 million.1
Face wash products are a considerable part of this market. One of the most widely used active ingredients in many OTC face washes is salicylic acid (SA), commonly at a 2% level. In nature, SA is found in the bark of the willow tree Salix alba. Salicylic acid is a β-hydroxy acid, making SA formulas milder than those based on benzoyl peroxide or α-hydroxy acids. It acts as an anti-comedogenic and a bactericide.
SA has a pKa of 2.9 and causes desquamation by breaking the bonds between corneodesmosomes and corneocytes.1 Typically, the pH of SA-based cleansers ranges from 3.7 to 4.8 so that SA will be ionized between 85% and 99%. As such, SA has both polar and non-polar structural moieties, which ultimately determine the solubility and formulation characteristics; i.e., the polar –COO– and –OH groups, and the nonpolar phenyl group.
Optimizing the delivery of SA from face washes is important to the efficacy of these products, so noninvasive in vivo methods are desired to screen candidate formulas. And due to its phenyl group, SA fluoresces at an excitation and emission maxima near 302 nm and 350 nm, respectively (see Figure 1). The sensitivity of fluorescence spectroscopy can therefore be used to detect SA deposited onto skin from wash-off products; this is the subject of the present work.
Materials and Methods
Test site, conditions and baseline: One rectangular, 3 cm × 6 cm test site was demarcated on each forearm of subjects using a surgical marking pen. The sites were located on the volar side, midway between the wrist and elbow, with the major axis oriented parallel to the wrist—elbow direction. During all tests, the water temperature and flow rate were respectively controlleda at 37°C and 35, corresponding to 1.4 gal/min. After moistening the sites, approximately 0.5 mL of a mild cleanserb was applied. Subjects washed with a gentle back and forth motion for 30 sec, after which the sites were rinsed for 10 sec and patted dry. Baseline fluorescence measurements were then acquired at each site before washing with a test product.
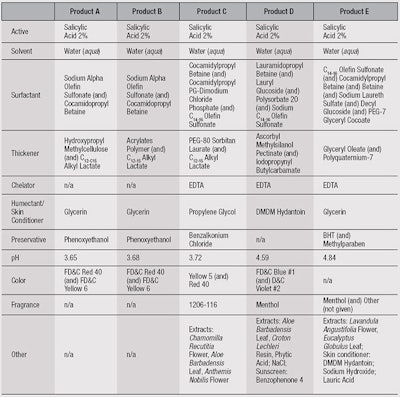
Test protocol: A 0.1-mL undiluted sample of one of five different test products (see Table 1) was then applied to the moistened site using a syringe. Subjects washed the sites using same back and forth technique, for 30 sec, after which they allowed the product to remain for an additional 10 sec. A 10-sec rinse followed. The sites again were patted dry and fluorescence measurements were made.
Calibration: For the calibration and validation of direct deposition, products were diluted 99:1 (w:w) with distilled water so that a 12-µL dose delivered a surface coverage of 500 ng/cm2 when applied to a 2 cm × 2 cm square. Solutions were deposited onto the skin using a pipette and distributed with a non-stickc stir bar. Once the product was absorbed, the excitation/emission matrix (EEM) was acquired.
A calibration was performed on one volunteer and the results were used across all volunteers with a correction for skin tone, described later. All calibration points and wash-off data were acquired in triplicate. Fluorescence excitation emission matrices were detected using a spectrometerd with a xenon lamp as the excitation source. The output wavelengths of the xenon lamp were scanned from 240 nm to 350 nm, and the integration time was set to 0.01 sec. The emission grating used was optimized for a fluorescence region of 210 nm to 600 nm.
Fluorescence detection: To sample skin fluorescence, a 1-m, bifurcated fiber optic probee was used whose fiber optic interface is located inside the spectrometer sample compartment rather than the usual cuvette holder. Incident light on the skin excites the fluorescence of endogenous fluorophores and salicylic acid, and this signal is collected through the fiber and directed back to the fiber optic interface to the emission grating. The grating disperses the fluorescence onto a cooled charge coupled device (CCD) detector. The entire fluorescence spectrum, excited at a given wavelength, is detected during one integration period.
Noninvasive sampling: The sampling end of the probe contains fibers for both excitation and emission, randomized and contained in a single bundle that is supported by an adapter. This reinforces the fiber bundle orientation and makes it possible, via a set screw, to vary and fix the distance between the end of the fiber bundle and the skin surface. In this case, a 2-mm space was set between the end of the fiber bundle and the opening of the adapter to allow fluorescence from the skin surface and beneath it to be sampled; if the bundle were to contact the skin, fluorescence from the surface would not be sampled.2
Test products: Five products, labeled A through E, each were evaluated on 9 subjects. Products A and B were prepared, whereas C, D and E were commercial products (see Table 1).
Statistical analysis: On the data collected, multivariate analysis was performedf and the significane of deposition results was determined using Analysis of Variance (ANOVA) softwareg.
EEM and PARAFAC
To visualize fluorescence results, the EEM was plotted (see Figure 1) as a three-dimensional depiction of excitation wavelength, emission wavelength and intensity. First, however, the EEM data was evaluated in a qualitative sense to ensure that known sources of variability were accounted for, and that unknown sources of variability were identified. This was achieved through Parallel Factor Analysis (PARAFAC), which resolved the experimental EEM data into component spectra.3, 4 Visualizing three-way data in such a manner can yield unique solutions.5
The first step to PARAFAC analysis is an initial pre-processing step, which accounts for the fact that skin is a scattering substrate, and sets variables such as Rayleigh bands and emission wavelengths that are less than the excitation wavelength to zero. Next, the EEMs from the wash experiment are collected into a dataset for PARAFAC analysis. Finally, the reconstructed spectra are compared with the known EEMs of SA and skin to confirm the sources of variability in the data.
Representative EEMs before and after washing are shown in Figures 1a-b. The major sources of variability for both excitation and emission, referred to as “Component 1,” are shown in Figure 2a-b. Component 1 accounted for 73.87% of the variability in the data, which is due to the deposition of SA. However, the PARAFAC model also isolated a second, smaller component, accounting for 4.88% of the variability. This was attributed to variations in baseline excitation and emission between subjects. Note that PARAFAC was able to identify these two overlapping sources of variability.
Calibration Model
Multi-way (or N-way) partial least squares regression (NPLS) was then used to build a calibration model. Validations of this model have previously been discussed.6 A dataset consisting of the spectra acquired in the deposition experiment, described above, was assembled with each EEM having an associated known level of SA deposition. The calibration plots are shown in Figure 3.
Here, the red line is the calibration model; the green line is a visual reference, having a slope of 1. The calibration was taken over two ranges because the fluorescence intensity is linearly proportional to concentration over a limited range of concentrations; or, in this case, surface coverage. This is observed by a deviation from linearity with increasing concentration.7
Deviations occur for several reasons. At a sufficiently high optical density, the light intensity reaching the observation zone of fluorescence—i.e., each collection fiber—is reduced from the incident value. While this is negligible at small concentrations or coverages, it can be substantial as these are increased. The increase in fluorescence intensity decreases with increasing concentration, giving rise to a “flattening-out” of the calibration at higher concentrations.
However, the NPLS regression is multivariate and the calibration is a factor of several “latent variables;” i.e., sources of variability in the data in addition to and including changes in SA coverage. NPLS can identify these latent variables, and a more linear model results when the latent variables are built into the calibration. Division of the calibration into two regions also contributes to linearization. In this case, the regions selected were 0–2,000 ng/cm2 and 2,000–4,000 ng/cm2. The r2 of calibration for the lower coverage was 0.94, and for the higher was 0.92.
Interestingly, the prediction for baseline (zero) was often not exactly zero, and this was different for each subject. Also, the baseline values were lower, and sometimes negative, for subjects having darker skin than the subject whose skin was used for calibration, resulting in under-predictions relative to the calibration subject. In contrast, the baseline values were higher and more positive with skin lighter than that of the calibration subject, resulting in over-prediction. The reason is due to the nature of skin optics and the number of processes incident light may undergo.8
In brief, incident light on the skin will be absorbed by SA and endogenous species. It can also be scattered to greater depths by the epidermis and dermis, and then be scattered back toward the surface. In the case of fluorescence, light that is not absorbed when initially passing through SA at or near the surface can be scattered back toward the surface, where it may then be absorbed by SA. Furthermore, fluorescence can be scattered toward the basal epidermis and absorbed by other species, such as melanin. All of these processes can account for the noted increases or decreases in fluorescence depending upon skin tone. Thus, the non-zero values were subtracted from the raw prediction values as a correction for skin tone.
Results and Discussion
The mean values predicted for the deposition of SA from the face wash products studied here are given in Table 2. The units are ng/cm2 and the error/standard deviation is reported at p < 0.05.
Deposition from products A, B and C was significantly higher than D and E. Deposition clearly can be influenced by a number of factors, including pH, water temperature and flow, and formulation parameters. Here, it is notable that the three highest-depositing formulas had virtually the same pH and contained C12-15 alkyl lactate.
This ingredient is used as a thickening agent, solvent and emollient. It also can be emulsified and form micelles in which the SA phenyl ring may interact with the lactate alkyl chain. The carboxyl group may interact with the lactate hydroxyl hydrogen as well, and the phenyl hydroxyl group may also interact with the ester carboxyl group—and since the alkyl lactate interacts with the skin surface by precipitating on it, this could carry the SA with it, aiding with deposition.
Conclusion
Here, the measurement of SA deposition onto skin from wash-off products was demonstrated noninvasively using fluorescence EEM. Results indicated formulas containing C12-15 alkyl lactate deposited more SA than those without it.
References
- A Decker and EM Graber, Over the counter acne treatments, a review, J Clin Aesthet Dermatol 5(5) 32-50 (2012)
- L Brancaleon, G Lin and N Kollias, The in vivo fluorescence of tryptophan moieties in human skin increases with UV exposure and is a marker for epidermal proliferation, J Invest Dermatol 113 977-82 (1999)
- R Bro, PARAFAC. Tutorial and applications. Chemo Intell Lab Systems 38 149-71 (1997)
- CA Stedmon and R Bro, Characterizing dissolved organic matter fluorescence with parallel factor analysis: A tutorial, Limnol Oceanogr Meth 6 572-79 (2008)
- A Smilde, R Bro and P Geladi, Multi-way Analysis. Applications in the Chemical Sciences, John Wiley and Sons, Hoboken, NJ USA (2004) pp 102-105
- MA Davies, Salicylic acid deposition from wash-off products: Comparison of in vivo and porcine models, Int J Cosmet Sci 17 526-531 (2015)
- J Lackowicz, Principles of Fluorescence Spectroscopy, 3rd edn, Springer, Berlin (2006) p 55
- RR Anderson and JA Parrish, The optics of human skin, J Invest Dermatol 77 13-19 (1981)


