Traditionally, oil emollients have been considered as raw materials having smoothing or softening properties. They are put into cosmetic products to provide moisturizing benefits and to support a variety of conditioning claims.1, 2 Sensory science has enabled companies to gather objective and scientific results to support such claims, and to qualify and quantify the sensations perceived by consumers.3
Sensory science is still new in the cosmetic area, compared with the foods industry, so a sensory science standard for assessing cosmetic oils has not yet been established. For this reason, a bibliographic review was previously undertaken4 to define which of the classical methods could be the most suitable for emollients. The classical method, Quantitative Descriptive Analysis (QDA), using a trained panel was not found to be sufficient to test this type of raw material. As a result, a novel “Oil Sensory Qualification” method was introduced4 in January 2018.
This sensory method allows for the global comparison of several oils by only a few attributes, selected by chemists. Like other new sensory methods published in the last couple of years (projective mapping, free sorting, etc.),5-9 this approach provides similar results to the QDA method but in a shorter time.
The benefit of classical sensory methods, however, is they are consistent over time because of the trained panel. It is well-established that when a panel has good performance and is well-calibrated, the measurements are stable over time.3 On the other hand, few of the recent sensory studies published in the food and cosmetics areas have investigated whether sensory results are consistent over time.10
The aim of the present study therefore was to validate the consistency, over time, of the Oil Sensory Qualification method by repeatedly introducing the same raw material multiple times during the same session. Some raw materials also were repeated during different sessions to compare results.
Test Protocol
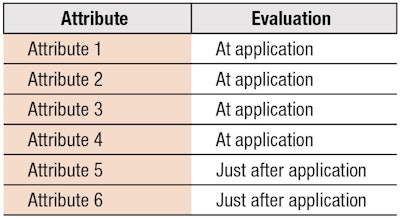
In-house formulation chemists (n > 10, minimum) were recruited to perform the Oil Sensory Qualification sessions based on their expertise in formulation and use of the oils. A quick training was performed to set standards and ensure the six chosen attributes and their evaluation protocols were understood (see Table 1) at the beginning of each session. (Editor’s note: For proprietary reasons, the six attributes are generalized in the present article.)
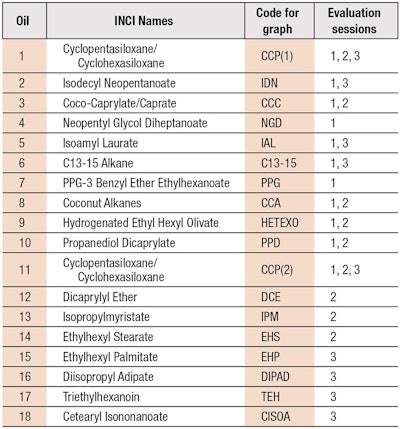
In total, 18 samples were tested (see Table 2) and three different sessions were performed—Session 1, 2 and 3. Cyclopentasiloxane/cyclohexasiloxane (CCP), one of the raw materials, was presented twice during each session—i.e., CCP(1) and CCP(2)—to measure the consistency of the panel during this session.
In addition, some materials such as isodecyl neopentanoate (IDN) and coco-caprylate/caprate (CCC) were presented in two different sessions—i.e., Sessions 1 and 2, or Sessions 1 and 3—to measure the consistency of the methodology over time. A maximum of 11 raw materials per session was presented following current sensory science standards: identical packaging, same quantity, random three-digit code identifier (different from one another), raw materials presented in different orders following the Latin square plan, etc.
The formulation chemists tested the samples, one after the other, and answered a sensory questionnaire. They applied one drop of oil to their volar forearms and evaluated it for a total of 90 sec, assessing four attributes during application and two attributes after application. At the end of the evaluation, the chemists chose which two attributes best characterized the given sensory perception during and after application and reported their choices in the questionnaire. The assessments were performed under standard sensory test conditions; i.e., dedicated room, independent evaluations, controlled temperature and humidity, etc.11
Data Collection and Analysis
First, the oil assessment data was collected for each sample and each session. The attributes chosen by panelists for best sensory characterization were graded as “1”; attributes not chosen were graded “0.” The sums of these grades per oil were compiled into a global matrix to perform a multidimensional statistical analysis referred to as a correspondance analysis (CA).6 This allowed for the global representation of results per session (see Figure 1, Figure 2 and Figure 3) and was performed using softwarea.
As a second step to check the consistency of results over time, CA global matrices were modified to compare only those oils evaluated during two different sessions; i.e., the same six raw materials evaluated in Sessions 1 and 2; the same single raw material evaluated in Sessions 2 and 3; and the same five raw materials evaluated in Sessions 1 and 3.
The Rv coefficient was used to analyze the similarity of results between the two sessions. If the Rv value range was between 0.7 and 1, the two global sensory representations were considered to be similar.12, 13 If the Rv value was lower than 0.7, the two sensory representations were considered to be different from one another. The Rv coefficient was calculated using softwareb.
Results: Session 1
A global representation of the sensory differences between the 11 oils was obtained by CA (see Figure 1). Here, 81.5% of the information was represented, meaning a high level; a minimum of 75% was expected.
Axis description, Figure 1: On the horizontal axis, Attributes 3 and 6 are located on the left corner of the map, opposite of Attributes 1 and 2. On the vertical axis, Attribute 4 is located on the top area of the sensory map. Attribute 5 is in the middle of the map.
Oil description, Figure 1: Two groups of oils are clearly differentiated on the horizontal axis: CCP(1) and CCP(2); and isoamyl laurate (IAL), hydrogenated ethylhexyl olivate (HETEXO) and PPG-3 benzyl ether ethylhexanoate (PPG). On one hand, these five oils can be discriminated from the others, since CCP(1) and CCP(2) are more defined by Attributes 3 and 6. On the other hand, IAL, HETEXO and PPG are located on the right of this axis. Hence, these three are more characterized by Attributes 1 and 2.
To validate the consistency, over time, of Oil Sensory Qualification, the same raw material was introduced multiple times in the same session or in different sessions.
Furthermore, few oils are differentiated on the vertical axis. Neopentyl glycol diheptanoate (NGD) and C13-15 alkane (C13-15) are located on the top of the map. These are more defined by Attribute 4 and are different from the rest of the oils. Few oils are in the middle of the map; coconut alkanes (CCA), IDN, CCC and propanediol dicaprylate (PPD) are defined by Attribute 5.
Results: Session 2
A global representation of the sensory differences between the nine oils was obtained by CA (see Figure 2). Here, 88.5% of the information is represented.
Axis description, Figure 2: On the horizontal axis, Attributes 3 and 6 are located on the right corner of the map, opposite of Attributes 1 and 2. On the vertical axis, Attribute 4 is located on the bottom area of the sensory map; Attribute 5 is in the middle of the map.
Oil description, Figure 2: Two groups of oils clearly differentiated on the horizontal axis are: CCP(1), CCP(2), dicaprylyl ether (DCE) and CCA; and HETEXO and ethylhexyl stearate (EHS). These six oils can be discriminated from one another since CCP(1), CCP(2), DCE and CCA are more defined by Attributes 3 and 6, and HETEXO and EHS, by Attributes 1 and 2.
Furthermore, few oils are differentiated on the vertical axis; only PPD and isopropylmyristat (IPM) are located on the bottom of the map, as they are more defined by Attribute 4 and different from the other oils. One oil is in the middle of the map; CCC is defined by Attribute 5.
Results: Session 3
A global representation of the sensory differences between the nine oils was obtained by CA (see Figure 3). Here, 88.9% of the information is represented.
Axis description, Figure 3: On the horizontal axis, Attributes 3 and 6 are located on the left corner of the map, opposite of Attributes 1 and 2. On the vertical axis, Attribute 4 is located at the top of the sensory map and Attribute 5 is at the bottom.
Oil description, Figure 3: Two groups of oils clearly differentiated on the horizontal axis are: CCP(1), CCP(2), C13-15 and IDN; and ethylhexyl palmitate (EHP), triethylhexanoin (TEH) and cetearyl isononanoate (CISOA). These seven oils could be discriminated since CCP(1), CCP(2), C13-15 and IDN are more defined by Attributes 3 and 6, and EHP, TEH and CISOA, by Attributes 1 and 2.
Moreover, few oils were differentiated on the vertical axis; diisopropyl adipate (DIPAD) and IAL are located on the top of the map as they are more defined by Attribute 4 than the other oils. Attribute 5 is located on the bottom of the map; no oils were defined by Attribute 5, in this session.
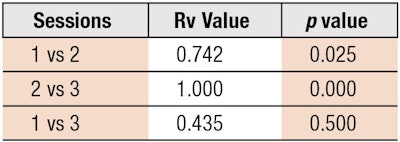
Rv coefficient values: The calculated Rv values and associated p values are shown in Table 3.
Comparisons
In this study, six raw materials were evaluated in both Sessions 1 and 2; one material was evaluated in Sessions 2 and 3; and five raw materials were evaluated in Sessions 1 and 3. As stated, the CA enabled the global representation of sensory differences for each session. The Rv coefficient also allowed for the calculation of the degree of similarity between two global sensory representations.
Sessions 1 and 2: The Rv value calculated from Sessions 1 and 2 was 0.74, with a p value = 0.025. This supported the conclusion that the six raw materials were defined the same way in both sessions.
CCP(1) and CCP(2) were described by Attributes 3 and 6; HETEXO was described by Attribute 1; and CCC, by Attribute 5. Only two raw materials, CCA and PPD, were not defined the same way in both sessions, which also is why the Rv value was not 1. In Session 1, CCA was described by Attribute 5, whereas in Session 2, it was described by Attributes 3 and 6. Also, in Session 1, PPD was described by Attribute 2, but in Session 2, it was described by Attribute 4.
Sessions 2 and 3: The Rv value calculated from Sessions 2 and 3 was 1, with a p value = 0.000. These results supported the conclusion that the two raw materials CCP(1) and CCP(2) were defined the same way in both sessions. In the three different sessions, CCP(1) and CCP(2) were sorted in the same group and defined by Attributes 3 and 6. This raw material, i.e. CCP, validated the consistency of the panel during a session and supported the consistency over time of the sensory method.
The global emollient esters market is expected to reach US $226.1 million by 2020, growing at a CAGR of 5.4% between 2015 and 2020.
Sessions 1 and 3: The Rv value calculated from Sessions 1 and 3 was 0.435, with a p value = 0.5. This showed some of the five raw materials were defined differently in both sessions. As mentioned earlier, CCP(1) and CCP(2) were sorted in the same group for both sessions and described by Attributes 3 and 6. In Session 1, IDN was described by Attribute 5; C13-15 was described by Attribute 4; and IAL was described by Attributes 1 and 2. On the other hand, in Session 3, IDN and C13-15 were described by Attributes 3 and 6, and IAL was described by Attribute 4. This highlights the fact that these three raw materials, in addition to the two materials tested in Session 1 (CCA and PPD) are more complex from a sensory point of view, and do not have a clearly defined sensory profile.
Discussion
The present validation of the Oil Sensory Qualification method’s consistency over time showed encouraging results. It also reinforced the possible use of Oil Sensory Qualification with other raw material categories; such as thickeners.4 However, some areas of improvement can be discussed.
In the validation study, for example, the consistency over time was shown for several raw materials, but not all of them. And for the chemists, some raw materials were easier to describe from a sensory point of view than others; this may indicate that different raw materials tested during the same session could impact the sensory perceptions of one another.
To help discriminate oils, two standards should be assessed during the evaluation. These standards could be consistent and representative of Attribute 1, and consistent and representative of Attribute 4. This would allow for more differentiation between oils with unclear sensory profiles. Indeed, a further finding of this study confirmed the use of the six attributes selected and the standards already tested during the preliminary study.4 Groups of oils were created in different sessions, and the chemists made discriminations between them and understood the sensations on which to focus. In total, 18 raw materials were assessed and, thanks to the consistency, sensory descriptions could be confirmed (data not shown).
Thus, the Oil Sensory Qualification method appears to be the more suitable and faster sensory methodology to qualify oils provided by different suppliers. As mentioned in the first article,4 QDA profiling and an expert panel would have taken five times longer to obtain consistent results.
Conclusion
Among the more recently published sensory test methods,5-9 few (if any) have been tested and confirmed for consistency over time, apart from the Oil Sensory Qualification described here. Consistency over repeated trials was also established for projective mapping.10 However, to leverage the full benefits toward the future use of this time-efficient sensory test method, sensory researchers must fully validate it by performing replication studies.
This study demonstrated positive results on the consistency, over time, of the new “Oil Sensory Qualification” method. This approach enables cosmetics companies to evaluate raw materials quickly and cost-effectively to provide support to chemists in the formulation process.
Acknowledgements: The author would like to thank the Oriflame R&D formulation chemists; Clara Le Berre and Emily Whelan for their participation; and all reviewers for their constructive comments.
References
- R Schuller and P Romanowski, Conditioning agents for hair and skin, in Cosmetic Science and Technologies Series, Dekker, New York 21 (1999)
- AM Pensé-Lhéritier, Conception des produits-la formulation, Coll Cosmetic Valley France, Lavoisier (2014)
- H Stone and JL Sidel, Sensory evaluation practices, Global Cosmetic Industry (2004)
- C Marque, Sensory insight: Emollient profiling accelerates speed to Market, Cosm & Toil 133(1) 52-57 (Jan 2018)
- M Santosa, H Abdi and JX Guinard, A modified sorting task to investigate consumer perceptions of extrac virgin oils, Food Quality and Preference (21) 881-892 (2010)
- V Dairou and JM Sieffermann, A comparison of 14 jams characterized by conventional profile and a quick original method, the Flash Profile, J Food Science 67(2) 826-34 (2002)
- P Faye, D Bremaud and M Durand Daubin, Perceptive free sorting and verbalization tasks with naıve subjects: An alternative to descriptive mappings, Food Quality and Preference 15 (7-8) 781-791 (2004)
- A Gambaro, ME Parente and A Gimenez, Free-choice profile descriptive analysis with conditioning agents, J Cosmet Sci (57) 455-63 (2006)
- ME Parente, G Ares and AV Manzoni, Application of two consumer profiling techniques to cosmetic emulsions, J Sensory Studies (25) 685–705 (2010)
- E Risvik, Projective mapping: A tool for sensory analysis and consumer research, Food Quality and Preference 5(4) 263-269 (1994)
- ISO 8589, Sensory analysis—General guidance for the design of test rooms (2007)
- B Escofier and J Pages, Multiple factor analysis, Computational Statistics and Data Analysis (18) 121-140 (1994)
- P Robert and PY Escoufier, A unifying tool for linear multivariate statistical methods: The RV-coefficient, Applied Statistics (25) 257–265 (1976)

