Although UVB represents the harmful part of the ultraviolet (UV) spectrum, UVA also needs to be considered in the global protection against sun exposure. There is a consensus on this, and recommendations or regulations on UVA protection are being taken into account throughout the world.
The in vivo persistent pigment darkening (PPD) method, proposed by the Japan Cosmetic Industry Association (JCIA),1 among several other proposals, is the one that has been recommended by the European Union (EU) Commission2 and now also in the imminent publication of 24442 International Organization for Standardization (ISO) normalization.
In the meantime, in vivo testing has also been challenged for ethical reasons due to the conditions of testing. In 2006, the EU Commission2 recommended in vitro method adoption as soon as possible, stating preference be given to in vitro testing methods delivering equivalent results, as in vivo methods raise ethical concerns. Proposals of in vitro methods had been made by BL Diffey and Robson on the principle of transmission measurement of a thin film spread on a substrate.3 The photostability that affects the level of UVA protection may or may not be taken into account. In case, a specific step of irradiation is defined. Different criteria to measure the broadness of absorbance4 or the balance between UVA/UVB5 had also been proposed.
As a first step, Colipa proposed an in vitro correlated method with this in vivo PPD method based on the transmission measurements. Additionally, it takes into account the quality of the protection provided from different parts of the spectrum with the evaluation of the critical wavelength (CW). Some adaptations have recently been proposed such as Colipa’s 2011 version,6 which increases the substrate from 2 µm to 5 µm, as it concluded that in vivo and in vitro correlation is good for both plates, but lower results were obtained on the lower plates and accuracy (agreement with in vivo values) is significantly better with higher roughness 6 µ plates. This in vitro method was well accepted and has been included, with a few changes, in the recent ISO 24443 proposal for a normalization of an in vitro method for UVA protection determination.
So it is now possible to express both “absolute UVA protection” such as an in vitro UVA protection factor correlated to the in vivo UVAPF (PPD), and “relative UVA/UVB protection” or broadness with the CW value, from the same set of data.
Because of the correlation between in vitro and in vivo data in the conditions that have been defined first by Colipa and then confirmed by the ISO, it is of interest to use the same absorbance data for both the absolute UVAPF calculation and the relative criteria calculations.
For the next AS/NZS 2604 modifications, it is clear that the Association of Southeast Nations (ASEAN) and Australia7 will account for the conditions of ISO’s proposal testing such as substrate, quantity and pre-irradiation step.
In 2007, the US Food and Drug Administration (FDA) amendment proposal was quite different from the final rule published in June 2011.8 In its proposal, the FDA suggested both “absolute” evaluations with a PPD UVA (exclusively in vivo) method in combination with a relative UVA1/UV criteria measured using an in vitro method in different conditions compared to those in the last proposal. The substrate proposed was undefined roughened quartz, the quantity applied was 2 mg/cm² and specific process of irradiation was given.
In the final rule, the FDA decided to adopt only one relative criterion to support the claim “broad spectrum”: the CW at least 370 nm. It has also been decided to adopt the same substrate (PMMA plates) proposed by Colipa and ISO instead of quartz plates.
Broad-spectrum UVA Determination
In order to avoid the use of clinical endpoints evaluated on humans, Diffey described a method based on spectro- photometic analysis9 to classify sunscreen products in different broad-spectrum categories. This was a simple approach reduced to a single index based on the wavelength λc where 90% of the area of the global curve between 290 and 400 nm is reached. This is the CW method.
Even if the FDA attempted to harmonize the parameters with existing standards, recent evolutions of the Colipa method and ISO proposal were not taken into account. It is important to review the influence of the conditions of measuring on the final value from which a product will or will not be “broad spectrum.”
Factors Affecting CW Results
It has been demonstrated10, 11 that defining the conditions of measurement (e.g., roughness, amount of product, irradiation conditions and substrate) is essential for the reliability of the method. It has already been illustrated that variability of the curve has been observed when the plate roughness is not well-controlled.
New molded platesa, HD2 and HD6 μm roughness, have been proposed, allowing intra and inter plates to reach a variability 10 times better than former sandblasted plates.12
Roughness is known as the most important parameter for variation. This has been clearly demonstrated by L Ferrero11 comparing 2 μm and the 5 μm plates. D Moyal has confirmed these important results and pointed out the higher the roughness, the higher the CW.10 Comparison of UVAPF values obtained by Colipa and ISO using 2 µm and 5 µm plates has shown, in both cases, good correlation with in vivo UVAPF values. However, allowing both types of plates increases the risk of variable results and then discrepancy of results between laboratories for the same product and, in the end, for labeling. This is why it has been decided to adopt one single type of plate roughness—the one with the best correlation with in vivo data—the 5µm plates.
In its last proposal, the FDA refers to the work done by Colipa. That is why it has been decided to propose PMMA instead of quartz. However, the FDA refers to the former version of Colipa, which referred to the 2 µm plates and the 0.75 mg/cm² amount of product related to this roughness level. Colipa never proposed using a roughness in a range between 2 µm and 7 µm. In the last version of the UVA Colipa guidelines, it was possible to use 5 µm unless the quantity was adapted to 1.3 mg/cm² instead of 0.75 mg/cm². However, the FDA has fixed the quantity at 0.75 mg/cm² at any roughness.
Additionally, a fixed irradiation dose in the FDA rule has been determined at a level of 800 J/m² efficient equivalent to 4 MEDs. The FDA reported that it is the maximum value for inducing total photostability for all sunscreen products marketed under the monograph. The effect of this single UV dose, whatever the roughness chosen, is questionable. The influence of the UV dose of irradiation is interesting because those chosen by the FDA are relatively low compared to realistic UV exposure for sunscreen products with different SPF levels.
The purpose of this study—to consider whether a great number of products are photostable or not—is to compare the CW in all of these conditions: roughness of 2 µm and application of 0.75 mg/cm², and roughness of 5 µm and application of both 0.75 mg/cm² and 1.3 mg/cm², before and after two levels of UV doses—the first following the FDA conditions, the second at a level close to the required exposure for a 50 SPF-claimed product in the EU.
Materials and Methods
Substrates: Molded HD2 and HD6 plates were used (see Table 1a and 1b).
Appliances: A spectrophotometer that complied with the FDA rule was usedb. The FDA requires the lamp used for transmittance measurements to have continuous spectral distribution from 290–400 nm; the spectrophotometer used has a flash lamp with continuous spectral distribution for measurements. The FDA acknowledges that the dynamic range of the measurement instrument must be 2.2 AU or higher; the spectrophotometer used has a dynamic range of 2.7 AU. The FDA suggests using an integrating sphere-based instrument for in vitro tests; the spectrophotometer used has input optics designed for diffuse illumination with spectral on lined integrating sphere.
UV Source: Irradiation was realized in a calibrated testing devicec. Total irradiance was limited to 500W/m², which produces 71.3 W/m² in the testing device used following calibration (see Table 2).
Two different UV doses were used. For complying with FDA, a UV dose of 4 times 200 J/m²-eff was used, which represents 8 J/cm² of UVA-UVB. With the conditions, (7.62 mW/cm² in total flux) the exposure time was 17.65 min. For approached simulated conditions for a claimed SPF50 in the EU, a level of 17/18 is required for UVAPF corresponding to around 22 J/cm² in UVA. The irradiation duration was fixed at 50 min in the solar simulator.
Products: A total of 29 cosmetics, most of them commercial products, were selected from the laboratory with different cosmetic presentations, including makeup products, with SPFs between 2 and 90 (in vitro evaluation).
Protocol: Products were spread with a gloved finger on the entire surface of the plates. Each assay was done on two plates. To avoid spreading difficulties, both plates and products were kept in a chamber at 28°C±1°C for 24 hr before spreading. Products were settled for 15 min at RT to ensure self-leveling. Nine measurements were recorded from 290 nm to 400 nm. Each operator was asked to comment about the spreadability depending on the plates and/or the quantity.
Variability of the Transmission Curves Measurement
As the operators had been asked to comment on the ability for spreading, some improvements were reported for products when spreading the lower quantity on the higher roughness. As two different kinds of roughness were used and also two HD6 plates, it was interesting to report on the result of the variability of the measurement of the UVR absorbance curves within the plates.
For all of the measurements on each plate, the calculation of the surface under the curve of UVR absorbance was made and compared with the mean curve of all measurements within the plate. The absolute difference was expressed at a percentage of dispersion of the absorbance measurement.
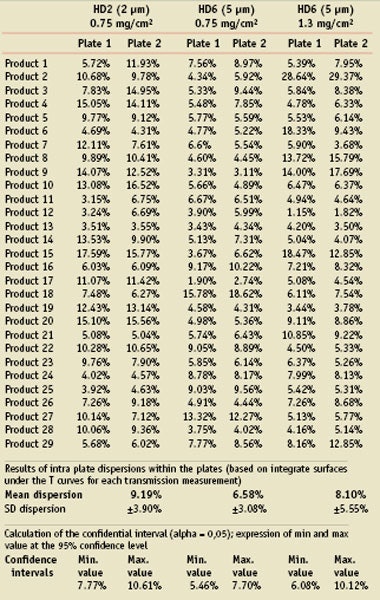
Table 3 shows the results for each assay and the statistical results. From these results, the confidence intervals have been calculated for each case to estimate the variability expected on the graph measurement depending on the conditions of spreading (roughness and quantity).
It was observed that spreading on 5 µm with both quantities allows on average a lower variability in the UVR absorbance curve measurement, unless it is clear it is product-dependant. Not only is the dispersion better for the 5 µm, but it is also more regular with the lower quantity (0.75 mg/cm²) as shown in Figure 1, which is the expression of the minimum and maximum value of the confident interval for each roughness and quantity.
Variability of the CW Measurement
Determination of CW requires only the UVR absorbance, and it reduces the dependence of the operator. It is also quite independent of the absolute value. Despite the differences, depending on the roughness and the quantity applied, these different operating conditions do not impact the reproducibility of the CW measurement and also evaluates its proper variability.
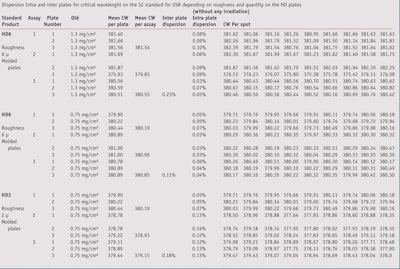
To study the variability of the measurements, the new S2 standard sunscreen formulation,13 which was included in the 2011 modification of the UVA in vitro Colipa method, was measured. As is demonstrated in Table 4, in using this formulation there is a low dispersion on the CW results’ intra or inter plates. The variability is not dependent on the roughness or product quantity applied. According to these results, for this product and in this condition within a laboratory, nine measurements on three plates allow the variation of CW values to be estimated.
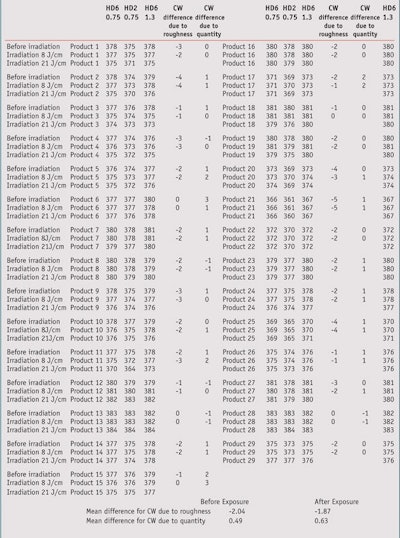
Table 5 shows the results of CW measurements. When comparing, the CW values obtained before irradiation, it can be observed that, on average, there is a difference of around 2 units between the 2µm and 5µm plates for the same 0.75 mg/cm² rate of product with a range from 0 nm to 5 nm.
For the same roughness 5 µm, with the 1.3 mg/cm² rate of product, there is an average increase of around 0.5 nm compared to the 2µm plate. Thus, the roughness parameter has a bigger influence than the amount of product.
CW Values after Irradiation at 4 MEDs (8 J/cm²) for the Two Types of Roughness
When comparing, the CW values obtained after an 8 J/cm² irradiation (Table 5), it can be observed that on average there is still a difference of around 2 units between the 2µm and 5µm plates for the same 0.75 mg/cm² rate of product with a range from 0 nm to 5 nm. Thus, the same difference between the two plates on average before and after UV irradiation was observed. There is no increase of the differences due to the plate roughness.
When comparing the effect of the irradiation for the same roughness 5 µm but at a different rate of product (0.75 mg/cm² versus 1.3 mg/cm²), there is about the same low difference as before irradiation.
Influence of Irradiation Dose on the CW Results
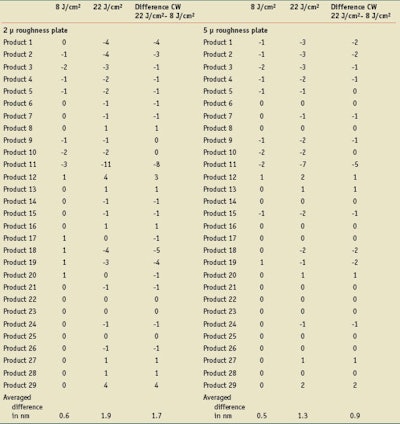
Because of the low UV dose chosen by the FDA, especially with regard to the highest SPF products, the influence on CW of a higher UV dose was compared to the 4 MEDs. For the two types of roughness, Table 6 reports the evolutions of CW values, in both cases 2µm and (expressed as the difference of CW values before and after irradiation), for the two levels of irradiation 8 J/cm² and 22 J/cm².
On the 2 µm plates, the 4 MEDs irradiation dose induced a decrease of the CW values (from 1 to 3 nm) for seven of the 29 products and an increase of 1 nm for five products. On the 5 µm plates, the same UV dose induced a decrease of the CW values (from 1 to 2 nm) for nine products, and an increase of 1 nm for two products.
On the 2 µm plates, the higher UV dose induced a decrease for 17 products and the decrease is higher compared to the lower UV dose, especially for products 1, 2, 11, 18, 19.
On the 5 µm plates, the higher UV dose induced a decrease of CW value for 13 products, which is a little bit higher than those observed with the low UV dose. However, the effect of the UV dose is less visible on the 5 µm compared to the 2µm plates.
Discussion and Conclusions
Using a relative index based on absorbance curve such as CW instead of absolute measurements is less sensitive to the application procedure. However, some parameters such as roughness and the amount of product can induce variability.
Measurements of 29 products on two plates with 2 µm and 5 µm of roughness and two quantities for the higher roughness demonstrate there is an intra plate dispersion between measurement of the UVR absorption curve, which is lower for the 5 µm than the 2 µm and better if the quantity is reduced to 0.75 mg/cm2.
In the CW evaluation, the intra and inter plate(s) variability, intra/inter plates and inter assay has been estimated low.
Therefore, it has been demonstrated that the use of the same 6 µm plates, unless using the required FDA quantity of 0.75 mg/cm², has no influence on the final CW values compared to the same plate with the “usual” amount of 1.3 mg/cm². However, the choice of 2 µm roughened plates is still possible as it would also keep within the FDA limits, but this would not be opportune as long as it was demonstrated by several authors, and now confirmed in this paper, that it leads to lower CW values.
The 5 µm plates have already been recommended in the UVA Colipa method and this choice has been voted on for the future ISO UVA normalization. It sounds logical to adopt the same roughness that ISO rules and most of the other legislation throughout the world that exists or is ready to be initiated. Additionally, it has been demonstrated that the UVA protection factor results, obtained with the in vitro Colipa method using the 5/6 µm plates instead of the 2µm plates, are better correlated with in vivo UVA protection factors (PPD method).
When comparing the two UV doses used in this work on the 2 µm plates, it appears that the UV dose chosen by the FDA induces less decrease of the CW than a realistic UV dose of 22 J/cm², which corresponds to approximately 1.5 hours under the sun.
In the case of Product 11, the CW value is lower than 370 nm, thus broad-spectrum properties are lost. In the case of the 5 µm roughness plates, the difference of CW between the two UV doses is low except for Product 11. Only five products have a difference of 2 µm in the CW final value. In those cases, the formula’s lack of photostability may depend on the UV parts of the curve due to the photochemical behavior different in the UVA and UVB ranges. Unless the data14 demonstrates that avobenzone-containing sunscreen products undergo almost complete photo degradation when exposed to doses between 2 and 3 MEDs, and there were no further decreases at a dose of 4 MEDs eff, it was observed that a few products still undergo photo degradation with modification on CW for over irradiation at 22 J/cm².
This phenomenon is still enhanced when using 2 µm roughness. Based on the data obtained on the 29 products in the different conditions, it is recommended to use one single condition of roughness to avoid variability of results. Due to the current harmonization process, it is recommended to use the 5 µm plates.
References
1. JCIA: Japan cosmetic Industry Association measurement standard for UVA protection efficacy (Nov 15, 1995)
2. European Commission Recommendation of the efficacy of sunscreen products and the claims made relating thereto, Official Journal of the EU L.265/39 2006/764/EC 39-43 Brussels (2006)
3. BL Diffey and J Robson, A new substrate to measure sunscreen protection factors throughout the ultraviolet spectrum, J Soc Cosmet Chem 40, 127–133 (1989)
4. BL Diffey, Spectal uniformity: a new index of broad spectrum (UVA) protection, IJSC 31 63–68 (2009)
5. Measurement of UVA:UVB ratios according to the Boots star rating system, Boot UK Limited (2008 revision)
6. Colipa: method for the in-vitro determination of UVA protection provided by sunscreen products—Guideline 2011
7. Dermatest newsletter (Dec 2010)
8. Department of health and human services Foods and drug Administration 21 CFR Parts 201 and 310 (Dockets N FDA-1978-N-0018) (formerly docket N 1978N-0038) RIN 0910-AF43
9. BL Diffey, A method for broad spectrum classification of sunscreens, IJCS 16 (2) 47–52 (1994) 10. D Moyal, UVA protection labelling and In Vitro testing methods, Photochemical and Photobiological Sciences 9 516–523 (2010)
11. L Ferrero et al, Importance of Substrate Roughness for In Vitro Sun Protection Assessment, IFSCC 9 (2) (2006)
12. M Pissavini, Characterizing Roughness: a New substrate to measure SPF, Cosm & Toil 124 (9) 56–64 (2009)
13. D Moyal, M Pissavini et al, In vivo persistent pigment darkening method: proposal of a new standard product for UVA protection factor determination, Inter J Cosmet Sci 29 (6) 443–449 (2007) 14. RM Sayre and JC Dowdy, Photostability Testing of Avobenzone, Cosm & Toil, 114 85–91 (1999)





!['[Sunscreen] developers will be able to innovate more efficiently while maintaining high standards of quality and safety for consumers.'](https://img.cosmeticsandtoiletries.com/files/base/allured/all/image/2024/06/woman_outside_using_sunscreen_on_face_ISO_test_standards_AdobeStock_783608310.66678a92029d9.png?auto=format%2Ccompress&fit=crop&h=191&q=70&rect=62%2C0%2C2135%2C1200&w=340)
