This is the second of a four-part series on SLNs and NLCs (see Part I, Part III and Part IV).
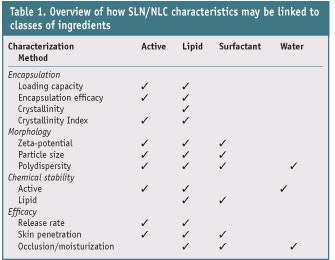
Part I of this review on SLNs and NLCs discussed the differences between these two systems, as well as their production methods and selection criteria for constituents.1 In this article, Part II, the characterization of these nano-sized particles is considered. There are, in principle, four different types of chemicals in an SLN or NLC that have different influences: an active ingredient, which can degrade; lipids that influence particle size, crystallization and morphology; surfactants that influence agglomeration; and finally, water. Table 1 provides an overview of these influences, which will be discussed here in arbitrary order. Various characterization methods relate to these influences, including: loading capacity (LC), encapsulating efficacy (EE), crystallinity and crystallinity index (CI), morphology, particle size and polydispersity index (PI). The chemical stability of the active ingredient and lipid components of the nanoparticle, the in vitro release of the active, and the rheology of the nanoparticle-containing formulation are also influences. These are discussed in greater depth in part III of this series.
Characterization methods such as LC, EE, and the chemical stability and in vitro release of the active are all based on active/lipid interactions, whereas characterization methods such as rheology and occlusion are dependent upon the interaction of all components of the formulation. Many of the characterization methods discussed in this article are based on measurements performed by Teeranachaideekul et al.2 These authors incorporated ascorbyl palmitate into NLCs composed of different lipids, i.e., glycerol monostearate (GMS), cetyl alcohol (CA) and beeswax (BW), and used various techniques to characterize the particles.
LC and EE
LC and EE are two different answers to the same question: How much active can one get into an SLN? This question can be interpreted in two different ways. First, how much SLN is active while the rest is lipid; second, how much active is inside the SLN while the rest is outside. The answers to these questions are called the LC and EE, respectively. Mathematically, they are expressed as shown in Eq. 1 and 2:

Wa refers to the weight of the active ingredient in the formulation, Ws is the weight of active ingredient analyzed in the supernatant—i.e., after separation of the lipid and aqueous phases by centrifugation, and WL is the weight of lipid in the formulation.3 This means that the LC describes how much of the SLN is a drug or active ingredient, whereas the EE describes the percentage of active ingredient that is incorporated with respect to that which is non-incorporated.
Factors that affect the LC of an active ingredient in lipid include: the solubility of the active in lipid melt, the miscibility of both the active and lipid melts, the chemical and physical structure of the solid matrix lipid, and the polymorphic state of the lipid material.4 This first factor, the effect of the lipid phase on the solubility of the active, causes the most prominent difference between SLNs and NLCs. SLNs are characterized by a single lipid with high purity, which negatively influences the inclusion of active ingredients in this “pure” crystalline system. NLCs will have, by definition, a higher LC because their imperfect crystalline structure caused by a mixture of lipids rather than pure lipid allows more active ingredient to be included. The LC is usually in the range of 5% to 10% w/w for SLNs but much higher for NLCs—up to 50% for ubidecarenone, in one report.5
The measurements for LC and EE consider active ingredient levels after they have been extracted or otherwise separated from the lipid matrix. If one knows the amount of active (Wa) and lipid (WL) added to a system, and the amount of active in the external aqueous phase is measured after separation (Ws), both the LC and EE can be easily calculated. In an ideal world, the EE is 100% and many reports in the literature actually claim such high a value,2, 6, 7 which is attributed to the selection of starting materials by means of lipid screening.8
Crystallinity and CI
As already discussed in Part I of this series on SLNs and NLCs, lipids can be present in different modifications. While both the thermodynamic stability and packing density of lipids increase, the LC of the active decreases in the order of: supercooled melt; α-modification (the hexagonal crystal structure); β'-modification, (the orthorhombic perpendicular structure); and β-modification (the triclinic parallel structure).3, 9 These four states are different polymorphic forms of the same lipid, which differ in their degree of rigidity. A change toward the most rigid and stable β-modification may happen with time but is undesirable as this often leads to the expulsion of the active. Polymorphic transformations during storage can be retarded by using co-surfactant molecules of high mobility to stabilize the system, and by mixing very chemically different lipid molecules (i.e., producing NLCs).3
The degree of crystallinity is therefore one important way to characterize the SLN and NLC matrices. This can be done by wide angle X-ray scattering (WAXS), an example of which is shown in Figure 1, where ascorbyl palmitate (AP)-loaded, semi-solid nanostructured lipid carriers were prepared using GMS, CA and BW.2 Different peaks can be seen in the patterns of bulk lipid before and after tempering (1 h at 90°C) in AP-free and AP-loaded NLCs, suggesting that heat treatment during nanoparticle production affects the lipid crystal structure. For instance, the 0.46-nm peak reflection represents the most stable and rigid β-modification, which reduces upon heating and forms new peak reflections such as the 0.42-nm. The emergence of such intermediate crystal forms suggests the lipid matrix rearranges itself in such a way that the active can be incorporated.
Another way to study the structure of the lipid matrix is via Differential Scanning Calorimetry (DSC). In this method, two aluminum pans—one empty pan and another containing the sample to be analyzed—are both heated while the equipment aims to keep the temperatures in the two pans the same. If there is a change in crystal state, the pan with the sample will require more energy than what is typically required to simply heat the sample. This is similar to what happens when boiling water or melting ice, i.e., energy is added but the temperature does not increase. Such scans are typically recorded from 25°C to 85°C at a heating rate of 5°C/min while flushing with nitrogen at a rate of 80 mL/min. The points measured include the onset, the melting point, the enthalpy, and the CI of the nanoparticle dispersions.
The CI is defined as the percentage of the lipid matrix that has crystallized during storage time. It is calculated using Equation 3:

ΔHNLC aqueous dispersion and ΔHbulk material are the melting enthalpy (J/g) of NLC dispersion and bulk lipid, respectively.2 While the CI% is useful for comparing the crystallinity between developed formulations, more fundamental knowledge can also be obtained in this way.10 For instance, the comparison of DSC patterns of bulk materials and those from NLC formulations provides information about the behavior of the solid and liquid lipid as a mixture. A blend of two lipids usually exhibits a lower melting temperature and lower enthalpy of the melting events due to the interrupted lattice of solid lipid. The presence of an active therefore also decreases the melting enthalpies of the lipid blend;11 an example thereof is given in Figure 2.
Moving from top to bottom, the top graph shows bulk lipid that is gradually mixed with additional liquid and solid sunscreen. The sunscreens used were ethylhexyl methoxycinnamate, benzophenone-3 and butyl methoxydibenzoylmethane in a 15:10:4 weight ratio.10 The onset of the melting point as well as the melting point itself is lowered as the amount of lipid is lowered. The same applies for the enthalpy and therefore the CI. Crystallinity and CI are measured to characterize the lipid state as this may change during storage and subsequently affect other parameters such as loading capacity and release. The preferred value of crystallinity and CI depends on the application, but it is true to state that whatever its value is, it should remain the same during the lifetime of the product.
Morphology
While the parameters describing LC, EE and crystallinity mainly relate to the lipid and incorporated active (see Table 1), the morphology of the nanoparticle also depends on the surfactant. As with all nanoparticles, absolute size and size distribution are important parameters—because they influence efficacy since surface area influences release rates—as is stability. Three different parameters are measured for these aspects of morphology. The absolute particle size can be measured using photon correlation spectroscopy (PCS) and laser diffraction (LD) analysis, whereas the spread in the particle size is reflected in the polydispersity index (PI). The zeta-potential is measured as an indicator for the stability of the particle.
Particle size and shape: The major difference between PCS and LD is that while PCS provides an average particle size and the spread therein, expressed in the PI, LD gives insight into the spread of the size via the volume distribution diameter d50%, d90% and d95%. These are the maximum diameters of a particle where 50%, 90% or 95% of the volume of all particles is included. For example, if the d90% is 245 nm, then all particles of 245 nm and smaller together represent 90% of the volume of all particles.
However, there is more to particle size than just size. Atomic Force Microscopy (AFM) and Scanning Electron Microscopy (SEM) can be used to investigate the particle size and shape, as well as the location of the active ingredient incorporated into lipid nanoparticles. Different physical shapes of SLNs and NLCs can be seen in Figures 3a-d. The three-dimensional AFM image in Figure 3a shows that the particle shape of NLCs may deviate from sphericity, which can occur due to polymorphic changes during the drying process. Drying under vacuum especially seems to result in non-spherical particles (Figure 3b). When cryo-field emission SEM is used as the analytical technique, however, almost spherical particles are observed.12
Figure 3c illustrates that SLNs also may agglomerate like any other nanoparticle—an action that normally can be prevented by the zeta-potential via the selection of an appropriate surfactant13—whereas Figure 3d shows the perfect spherical particles that are normally assumed to be present. Attention to the way the samples are processed during the characterization process should therefore be given since the means of analysis may influence the end result.
Particle size distribution: Whether the spread around the average particle size is small or large has a profound influence on the performance of SLNs and NLCs. Just a few big particles in a batch of otherwise small particles will contain a considerable percentage of the lipid volume of the sample and therefore also of the encapsulated material, which is subsequently not released as effectively as the same material from the smaller particles. Bigger particles also coalesce easier, just like bigger emulsion droplets,11 so a wider particle size distribution is indicative of lower stability.
The spread around the average particle size therefore must be assessed. This width around the average is expressed in the polydispersity index (PI), which may be obtained from the same assay described above to measure particle size and using a proprietary equationa defined in ISO 13321 Part 8. A low PI means that all particles are sized within a narrow range, and therefore the dispersion may be considered to be relatively homogeneous in size.11 For an ideal monodisperse system, the theoretical PI would be zero.15 Consistently high values of PI indicate either an aggregated or poorly prepared sample. If the PI is above 0.2, the PI loses its significance as an accurate measure but it can still be useful for comparative purposes.16
Non-spherical particles tend to have larger PI values, although according to Jores et al., particle size and PI should not be taken as absolute because particle size is concluded from the measurement of physical phenomena with several assumptions. These researchers found very different particle sizes before and after dilution of SLN samples: 198 nm in 1:100 diluted samples and 735 nm in undiluted samples. This is due to the fact that the diffusion length of the particles is limited by the presence of other particles, whereas particles are able to diffuse independently in diluted samples. This is translated in the PCS algorithm into a smaller particle size.17
Zeta-potential: The zeta-potential is defined as the surface charge of a particle. Similar to oil droplets in a suspension, solid particles dispersed in aqueous media are also electrically charged on their surface. This net electrical charge is essential to prevent the coagulation of oil droplets as well as nanoparticles.
The stability of an emulsion or particle dispersion is highly linked with the maintenance of the zeta-potential. Measuring the zeta-potential with time therefore predicts storage stability. Measurement of zeta-potential is, in fact, the determination of electrophoretic mobility using softwareb and applying the Henry equation shown in Eq. 4:

Z is the zeta-potential, UE is the electrophoretic mobility, ε is the dielectric constant, η is the viscosity of the medium and f(Kα) is the Henry function;16 another way of calculating the zeta-potential is by using the Helmholtz-Smuluchowsky equation.18
The magnitude of the zeta-potential gives an indication of the potential stability of a colloidal system. Absolute large negative or positive zeta-potentials are required for colloidal dispersion stability. The general dividing line between a stable and an unstable suspension considered either +30 mV or -30 mV.16 Any dispersion with zeta-potentials larger than these two values, i.e., more negative than -30 mV and more positive than +30 mV, should be stable. Remarkably, no systematic research has apparently been undertaken to address the question of what influences the zeta-potential of a particle, but useful information can still be obtained by combining a couple of research reports.
As already indicated in Table 1, the zeta-potential is influenced by the active, the lipid and the surfactant. The inclusion of an active ingredient or surfactant in an SLN or NLC can cause the particle’s zeta-potential to change due to the presence of polar groups in these molecules. Care should therefore be taken when including actives such as proteins or anionic surfactants with polar groups having either a positive or negative charge into SLNs and NLCs.11
Furthermore, not only do the components of the nanoparticle contribute to zeta-potential, but also the preparation methods.19 When Fang et al.20 compared the zeta-potentials of emulsions with nanoparticles, they found them to be higher, in absolute terms, for the lipid emulsions than for the nanoparticles. In a series of formulations, the researchers gradually changed the lipid phase from 100% glyceryl palmitostearate (a fat) to 100% squalene (an oil) while also changing the emulsifiers as indicated in Table 2. They observed a reasonable relationship between the zeta-potential and size, where larger zeta-potentials led to smaller sizes. However, there are many confounding factors. For instance, polysorbate 80c also imparted steric hindrance, allowing the particle size of this NLC to become much smaller than would be expected based on zeta-potential alone. Via some assumptions, it can be concluded that this steric hindrance allowed the particle size to be approximately 100 nm smaller than otherwise would have been the case (see Figure 4). Whereas this contribution of polysorbate 80 to the size reduction of nanoparticles is somewhat speculative, it clearly indicates the value of measuring zeta-potentials of nanoparticle-containing formulations.
References
Send e-mail to [email protected] or [email protected].
- JW Wiechers and EB Souto, Delivering actives via solid lipid nanoparticles and nanostructured lipid carriers: Part 1, Cosm &Toil 125 (10) 22–30 (2010)
- V Teeranachaideekul, EB Souto, RH Müller and VB Junyaprasert, Physicochemical characterization and in vitro release studies of ascorbyl palmitate-loaded semi-solid nanostructured lipid carriers (NLC gels), J Microencaps 25 111–120 (2008)
- EB Souto, AJ Almeida and RH Müller, Lipid nanoparticles (SLN, NLC) for cutaneous drug delivery: Structure, protection and skin effects, J Biomed Nanotechnol 3 317–331 (2007)
- RH Müller, K Mäder and S Gohla, Solid lipid nanoparticles (SLN) for controlled drug delivery–A review of the state of the art, Eur J Pharm Biopharm 50 161–177 (2000)
- K Westesen, H Bunjes and MHJ Koch, Physicochemical characterization of lipid nanoparticles and evaluation of their drug loading capacity and sustained release potential, J Contr Rel 48 223–236 (1997)
- V Sanna, E Gavini, M Cossu, G Rassu and P Giunchedi, Solid lipid nanoparticles (SLN) as carriers for the topical delivery of econazole nitrate: In vitro characterization, ex-vivo and in-vivo studies, J Pharm Pharmacol 59 1057–1064 (2007)
- S Doktorovová, J Araújo, ML Garcia, E Rakovský and EB Souto, Formulating fluticasone propionate in novel PEG-containing nanostructured lipid carriers (PEG-NLC), Coll Surfaces B: Biointerfaces 75 538–542 (2010)
- EB Souto, C Anselmi, M Centini and RH Müller, Preparation and characterization of n-dodecyl-ferulate-loaded solid lipid nanoparticles (SLN), Int J Pharm 295 261–268 (2005)
- W Mehnert and K Mäder, Solid lipid nanoparticles–Production, characterization and applications, Adv Drug Del Rev 47 165–196 (2001)
- Q Xia, A Saupe, RH Müller and EB Souto, Nanostructured lipid carriers as novel carrier for sunscreen formulations, Int J Cosmet Sci 29 473–482 (2007)
- S Doktorovová and EB Souto, Nanostructured lipid carrier-based hydrogel formulations for drug delivery: A comprehensive review, Expert Opin Drug Deliv 6 165–176 (2009)
- A Saupe, KC Gordon and T Kades, Structural investigations on nanoemulsions, solid lipid nanoparticles and nanostructured lipid carriers by cryo-field emission scanning electron microscopy and Raman spectroscopy, Int J Pharm 314 56–62 (2006)
- SE Cross, B Innes, MS Roberts, T Tsuzuki, TA Robertson and P McCormick, Human skin penetration of sunscreen nanoparticles: In vitro assessment of a novel micronized zinc oxide formulation, Skin Pharmacol Physiol 20 148–154 (2007)
- RH Müller, W Mehnert and EB Souto, Solid lipid nanoparticles (SLN) and nanostructured lipid carriers (NLC) for dermal delivery, in Percutaneous absorption: Drugs, cosmetics, mechanisms, methods, 4th edn, RL Bronaugh and HI Maibach, eds, Marcel Dekker: NY (2005) ch 53 pp 719–738
- H Bunjes, M Drechsler, MHJ Koch and K Westesen, Incorporation of the model drug Ubidecanerone into solid lipid nanoparticles, Pharm Res 18 287–293 (2001)
- AA Attama and CC Müller-Goymann, Effect of beeswax modification on the lipid matrix and solid lipid nanoparticle crystallinity, Coll surfaces A: Physicochem eng aspects 315 189–195 (2008)
- K Jores, W Mehnert, M Drechsler, H Bunjes, C Johann and K Mäder, Investigations on the structure of solid lipid nanoparticles (SLN) and oil-loaded solid lipid nanoparticles by photon correlation spectroscopy, field-flow fractionation, and transmission electron microscopy, J Contr Rel 95 217–227 (2004)
- MD Afonso, Surface charge on loose nanofiltration membranes, Desalination, 191 262–272 (2006)
- AJ Almeida and EB Souto, Solid lipid nanoparticles as a drug delivery system for peptides and proteins, Adv Drug Del Rev 59 478–490 (2007)
- J-Y Fang, C-L Fang, C-H Liu and Y-H Su, Lipid nanoparticles as vehicles for psoralen delivery: Solid lipid nanoparticles (SLN) versus nanostructured lipid carriers (NLC), Eur J Pharm Biopharm 70 633–640 (2008)
