Today, sun protection is generally accepted as a part of everyday life. This is due in part to the increased incidence in the number of skin cancers, as well as awareness campaigns. As such, more and more consumers demand efficient sun protection. They expect sunscreens to provide good UV protection, since overexposure to UVB (290 nm to 320 nm) and UVA (320 nm to 400 nm) leads to sunburn, premature skin aging and, potentially, the development of cancer.
They also look for sun protection with added characteristics, such as infrared (IR) protection. Indeed, research has highlighted the potentially harmful effects of IR, including: inflammation; heat damage; photoaging via the up-regulation of matrix metalloproteinase-1 (MMP-1) expression in fibroblasts; degeneration of nuclear DNA (nDNA) and mitochondrial DNA (mtDNA); the formation of free radicals; etc.1–4
On the contrary, some research demonstrates IR radiation can benefit humans. It shows energizing properties, which are useful in health care for blood circulation and to boost healing. Moreover, a recent study demonstrates that IR radiation helps to better prepare skin for upcoming insults, including UV-induced sunburn, and can be used to prompt photo-preventive measures.5 It may therefore be the case that similar to UV, the devil is in the dose, and relative protection can be effective regardless of the benefits or detriments IR has on skin.
Considering that more and more sun care products are claiming IR protection and in light of the precautionary principle, it is important for product developers to standardize the parameters by which their products are tested to substantiate this claim. As such, an in vitro method is required that can assess the IR protection of sunscreens; this was the focus of the present work.
According to the International Commission on Illumination (CIE), IR radiation can be divided into three bands: IR-A (700 nm to 1,400 nm), IR-B (1,400 nm to 3,000 nm) and IR-C (3,000 nm to 1 mm).6 Since IR-A and IR-B are the most implicated in skin damage, an IR protection test method was developed focused on these wavelengths. The resulting approach is described here.
Test Formulas
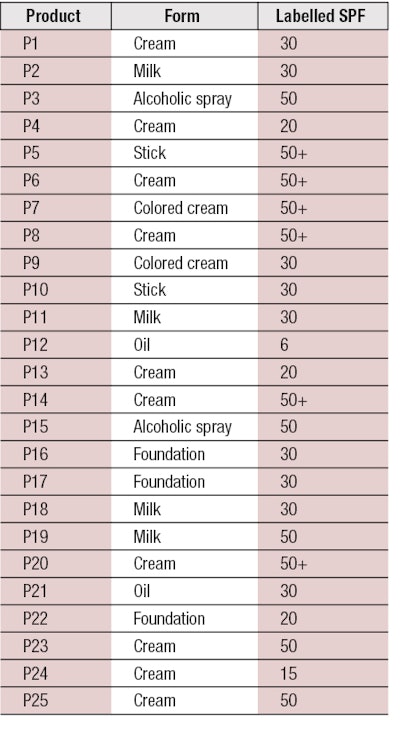
To perform the assessment, 25 products from different companies were tested (see Table 1). These comprised different forms—i.e., cream, milk, emulsion, oil, alcoholic spray, stick, etc.; and different levels of protection, ranging between SPF 6 and 50+ (per European Recommendation 2006 on the efficacy of sunscreen products and the claims made relating thereto).7
Substrate Selection
For the described tests, two types of substrates were used: molded polymethyl methacrylate (PMMA) platesa with one roughened face, for measurements from 290 nm to 700 nm; and quartz plates with one smooth face, for measurements from 700 nm to 3,000 nm. For this last range, quartz plates were chosen to avoid saturating the measurements with background noise. The application area on these two substrates measured more than 23 cm². To conserve the reproducibility of test measurements, all surface topography parameters of the molded plates were controlled with an ad hoc profilometer and complied with the specifications described in the ISO 24443:2012 standard (In Vitro UVA-PF Determination).8 Roughness was previously identified as an important factor for the reproducibility of absorbance curve shapes.9–11
Sunscreen Application
Before sunscreens were applied to test substrates, they were stored at 25°C for 24 hr and shaken to assure good homogenization. To obtain a constant and homogeneous layer, the thicknesses and amounts of the products spread were adjusted for the roughness of the substrates. Thus, a quantity of 1.3 mg/cm² was applied to molded PMMA plates whereas 0.75 mg/cm² was applied to quartz plates. In both cases, samples were deposited in nine spots using a 1-mL syringe.
Automated Spreading
Immediately after deposition, products were spread by means of an automated deviceb whose robotic arm performs precise and repeatable circular and linear strokes with controlled pressure. At the top of this arm, a silicone finger is used to mimic the human finger to allow for better spreading in terms of reproducibility.12
Drying Time
After products were spread, they were allowed to dry and set for 15 min at 25°C ± 2.0°C. During this drying process, the temperature of the product was controlled and maintainedc. Indeed, the influence of temperature on results during in vitro sunscreen testing has also been demonstrated.13
Sample Irradiation
To assess the photostability of products, it is necessary to perform an irradiation step. And to simulate a typical absolute UV exposure dose, rather than a dose proportional to the SPF number or UVA-PF, a fixed dose is preferred; in fact, this approach has been proposed according to existing in vitro methods recognized worldwide.14 For this purpose, a solar simulator was used to expose samples to 800 J/m²-eff—equivalent to 4 minimal erythema doses (MEDs), where 1 MED is equal to 200 J/m²-eff.
Transmittance Measurements
To assess the SPF and UVA protection factor (UVA-PF), and the critical wavelength (CW) of a sunscreen, the transmittance of a product must be measured by means of a spectrophotometer. For the present work, the absorbance amounts used were in the UV, visible, IR-A and IR-B ranges, as shown in Equation 1.

Here, A is the absorbance of the tested product; T is the transmittance of the tested product expressed as a percentage; and λ is the wavelength with an interval of 1 nm. To assess the entire UV, visible, IR-A and IR-B range, different spectrophotometers and substrates were used, depending on the wavelength being measured.
To obtain the UV spectrum, measurements were performed from 290 nm to 400 nm using a UV spectrophotometerd. For the visible, IR-A and IR-B spectrums, two approaches were used, with or without an integrating sphere. The function of an integrating sphere is to spatially integrate diffuse reflectance and illuminate samples with the complete spectrum and/or collect scattered transmission light. Without an integrating sphere, considering optical geometry and sample/device positioning, all the measured light from a sample could be missed, leading to a variance in the results. Thus, this study also provided a comparison in terms of the absence or presence of an integrating sphere inside the spectrophotometer.
For the present study, the first approach was to use a UV, visible and near-infrared (NIR) spectrophotometere including an integrating sphere. The second approach was to use a visible spectrophotometerf for measurements from 400 nm to 700 nm, and an IR spectrophotometerg for measurements from 700 nm to 3,000 nm.
IR protection factors should be comparable between products and provide the balance of UV, visible and IR protection within a single product.
Mathematical Adjustments
Using the described measurements, a total spectrum of the tested products between 290 nm and 3,000 nm is obtained. However, to correlate with in vivo methods and take the different substrates and spectrophotometers used into consideration, some mathematical adjustments are necessary.
Calculated in vitro SPF versus measured in vivo SPF: The first adjustment is to align the in vitro SPF calculated according to the UV spectrum measured (see Equation 2) with the in vivo SPF value. For this, the initial absorbance curve values are multiplied by a scalar value, C, until the in vitro calculated SPF values are equal to the in vivo measured SPF. This is accomplished in an iterative calculation process:

Eq. 2
Here, E(λ) is the erythema action spectrum (CIE-1987); I(λ) is the spectral irradiance received from the UV source (SSR for SPF testing); A0(λ) is the mean monochromatic absorbance of the test product layer before UV exposure; and dλ is the wavelength step (1 nm). The initial absorbance values multiplied by the C value become the adjusted sunscreen absorbance curve.
The calculation of the adjusted in vitro SPF, or SPFIn vitro, adj, and determination of the coefficient of adjustment, C, are described in Equation 3.

Eq. 3
Again, E(λ) is the erythema action spectrum (CIE-1987); I(λ) is the spectral irradiance received from the UV source (SSR for SPF testing); A0(λ) is the mean monochromatic absorbance of the test product layer before UV exposure; C is the correlation coefficient; and dλ is the wavelength step (1 nm).
Equipment variations: Other adjustments were made for differences in test equipment used. For this step, a Ratio(x) is calculated between one part of the absorbance curve already adjusted for the UV range (Aa1) and the second curve for the visible range (Aa2) (see Equation 4). Following this first step, the same logical principle is applied between the absorbance for the visible range (Aa3) and for the IR range (Aa4) to calculate the Ratio(y) (see Equation 5).
However, note that if the same spectrophotometer is used to measure the UV, visible and/or IR ranges, it is not necessary to calculate the Ratio(x). Indeed, if the same appliances are used, i.e., spectrophotometer and substrate, no mathematical adjustments are necessary.


Here, Aa1 is the absorbance from 395 nm to 400 nm in the adjusted UV range; Aa2 is the absorbance from 395 nm to 400 nm in the visible range; Aa3 is the absorbance from 695 nm to 700 nm in the adjusted visible range; and Aa4 is the absorbance from 695 nm to 700 nm in the infrared range. After these two ratios are calculated, they are multiplied to the absorbance values corresponding to the range requiring adjustment (see Equation 6 and Equation 7).


Here, A1 Vis is the absorbance mean between 400 nm and 700 nm after mathematical adjustments per substrate and per wavelength; A0 Vis is the absorbance mean initially measured from 400 nm to 700 nm per substrate and per wavelength; A1 IR is the absorbance mean between 700 nm and 2,500 nm after mathematical adjustments per substrate and per wavelength; and A0 IR is the absorbance mean initially measured between 700 nm and 2,500 nm per substrate and per wavelength.
All things considered, and after mathematical adjustments, Figure 1 shows an example of the final absorbance spectrum between wavelengths 290 nm to 3,000 nm for product P17.
Calculating IR Protection
Based on the adjusted spectrum, different IR protection factors can be calculated. One factor should provide an indication regarding a level of sun protection with which products can be compared. A second factor should provide an indication of the balance between the UV, visible and IR protection provided.
Percent of IR stopped by the product (%IR): For the first factor, initially the idea was to use the irradiance curve of the sun15 to measure an IR Protection Factor (IR-PF). However, calculating the %IR is preferred because it is more dynamic for the values obtained, being more sensitive to the small differences that have a large impact on the final value. In fact, contrary to the IR-PF, the %IR does not factor in the irradiance curve; instead, it indicates the IR percentage stopped by the tested product. In other words, it is the percentage of IR absorbed or reflected by the product.
Thus, the higher the percentage, the more the product protects the skin against IR. This factor can be calculated separately for %IR-A and %IR-B; or, for IR-A and IR-B combined (%IR), only the wavelengths (λ1 and λ2) change (see Equation 8 and Equation 9).


Here, T1 IR is the mean of the transmittance per substrate and wavelength; n is the number of transmittance measurements; for total %IR (i.e., %IR-A and %IR-B combined): λ1 is equal to 700 nm and λ2 is equal to 2,500 nm; for %IR-A only: λ1 is equal to 700 nm and λ2 is equal to 1,400 nm; for %IR-B only: λ1 is equal to 1,400 nm and λ2 is equal to 2,500 nm.
Products providing IR protection were mainly colored, allowing one to assume the pigments may have an influence on IR protection.
Critical wavelength extended to IR (IR-CW): The IR-CW is based on the same principle as the CW. However, instead of staying in the UV band, this wavelength is extended to the visible and IR bands.16, 17 This factor gives an indication of the balance between UV, visible and IR protection.
Similar to %IR, it is also possible to differentiate the CW for IR-A only (λIRA-CW) (see Equation 10) or IR-A and IR-B together (λIR-CW) (see Equation 11). The IRA-CW is equal to 90% of the area under the absorption curve of the total area between 290 nm and 1,400 nm. On the other hand, the IR-CW is equal to 90% of the area under the absorption curve of the total area between 290 nm to 2,500 nm. Following this mathematical principle, IR-CW can be named IRB-CW as these are equal.


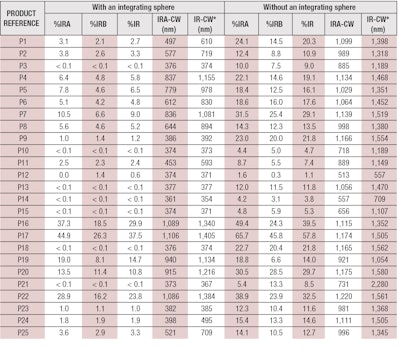
Here, A1 IR λ is the mean of the absorbance measurements after mathematical adjustments per plate and wavelength; and λ is the wavelength with an interval of 1 nm. The 25 products described previously (see Table 1) were tested and their %IRs were calculated. Results obtained with and without an integrating sphere are presented in Table 2.
Method Selectivity and Discussion
To ensure any method is credible and can distinguish between products, it must demonstrate reasonable selectivity. For this method, an 80–90% level of selectivity was set and the limits for each IR protection factor were calculated as follows, taking the integrating sphere into account:
%IR ≥ 10%; %IRA ≥ 12.5%; and %IRB ≥ 10%
IR-CW ≥ 1,200 nm; IRA-CW ≥ 900 nm; and IRB-CW ≥ 1,200 nm
According to these parameters, only four products of the 25 tested—P16, P17, P20 and P22—demonstrated IR protection efficacy (see Table 2). Adjustments to the chosen criteria could improve these results, although it is important to consider key aspects that may be affecting these results. For example, the fixed limits could indeed be too selective; the panel of products may actually only include four with real IR protection; or all the selected products may provide IR protection but in terms of biological effects rather than absorbance.
Moreover, for the IR-CW, we can assume that if the tested product absorbs greatly in the visible range, its IR-CW will be superior or equal to the fixed limit, even if the product does not show efficient IR protection. To check this hypothesis, the relative influence of the visible absorbance on the IR absorbance was calculated; internally, it was concluded there is no significant influence of this parameter on the IR-CW factor.
Finally, according to Table 2, it can be observed that the products providing IR protection were mainly colored, allowing one to assume the pigments may have an influence on IR protection in terms of physical effects only. Indeed, some inactive ingredients are capable of absorbing and/or scattering visible and/or IR radiation; such as iron oxides, titanium dioxide, zinc oxide, boron nitride, bismuth oxychloride, nylon-12, lithium magnesium sodium silicate, magnesium aluminium silicate, polyacrylamide, silica, boron nitride, etc.17 Moreover, from these results, it seems there is no link between the level of SPF and IR protection. In fact, products P9 and P17 both had an SPF of 30 but %IRs of 1.0% and 37.5%, respectively.
Furthermore, limits of selectivity can be set without consideration for the integrating sphere. These are as follows:
%IR ≥ 25%; %IRA ≥ 30%; and %IRB ≥ 20%
IR-CW ≥ 1,500 nm; IRA-CW ≥ 1,100 nm; and IRB-CW ≥ 1,500 nm
According to these parameters, it is interesting that just three products—P17, P20 and P22—exhibited IR protection according to transmittance measurements with or without an integrating sphere. And in either case, with or without the integrating sphere, one product seems to behave differently: product P16. This product passed the criteria limit with an integrating sphere and failed it without an integrating sphere. Why? Considering its formula, a high quantity of several inactive ingredients could explain this difference.
On the contrary, product P7 passed the criteria limit without an integrating sphere and failed with an integrating sphere. This difference can be explained either because values are borderline, as far as the limits, or perhaps a scattering effect is being missed, which leads to an overestimate of IR protection. Taken together, the integrating sphere is therefore strongly recommended to avoid any overestimation of IR protection values or false positives.
Only four products showed IR absorbance but other means of IR protection must be considered, such as biological efficacy.
Repeatability and Reproducibility
Credible methods must also be repeatable and reproducible by others under the same conditions, e.g., laboratory, equipment, method, etc., with the same products. A moderate and reasonable variation, or coefficient of variation (%CV), should fall below 20%, which in this case must be evaluated for all %IR values. For this purpose, five products were tested three times with the same operator and under the same conditions to evaluate the repeatability of the method. The %CV obtained for the three assays with each product and each %IR value are shown in Figure 2.
Here, the fixed objective achieved a %CV of less than 20%. Indeed, the maximum CV was 19.5%, for product P10. Interestingly, the %CV mainly depended upon the product tested; products P10 and P14, for example, gave more varied results between the different assays.
This difference in terms of %CV is mainly due to the composition of the product that change their physical-chemical parameters (superficial tension, rheology, density, volatility, etc.) and its ability to be spread over the substrate, creating a more or less uniform film.
Reproducibility is another parameter crucial to the validation of a method. A method is considered reproducible when the same method is used under different conditions and still maintains a %CV of less than 20%; in this case for all IR factors, as previously described. Thus, the same tests were performed by different operators, with different appliances and at different times. Again, five products were tested but by three different operators in under several different test conditions. The %CV obtained for each product and each IR protection index are illustrated in Figure 3.
According to the data, this test method was deemed reproducible since the maximum %CV obtained was 14.6%; although it is worth noting variations in results depended upon the products tested. Indeed, some were more difficult to test, such as product P14.
Conclusions
This study shows the development of an innovative in vitro method to assess the IR protection provided by sun care products. First, sample products are spread onto molded PMMA and quartz plates, and these substrates are irradiated. The transmittance of UV, visible and IR wavelengths are measured using various spectrophotometers, then mathematical adjustments are made to correlate with in vivo values and to obtain product absorbance spectrums between 290 nm and 2,500 nm. According to this spectrum, the %IR and the IR-CW can be calculated to obtain the final IR protection value for each product.
To be credible and selective enough, an 80–90% selectivity limit was set among all the tested products. This resulted in just four of the 25 sunscreens tested, i.e., an 84% selectivity, exhibiting results to substantiate claims for IR protection. In fact, using an integrating sphere, this method showed test products exhibited IR protection when their %IR was greater or equal to 10% (%IRA ≥ 12.5% and %IRB ≥ 10%), and the IR-CW was greater or equal to 1,200 nm (IRA-CW ≥ 900 nm and IRB-CW ≥ 1200 nm). If one of these criteria (%IR and IR-CW) was not met, the product was not deemed to demonstrate IR protection. Furthermore, IRA or IRB protection could be separately claimed if both criteria (%IRA and IRA-CW or %IRB and IRB-CW, respectively) were met.
In addition, the importance of the integrating sphere was demonstrated so as to avoid any overestimation of IR sun protection. Nevertheless, without an integrating sphere, other criteria limits could also be used to claim IR protection.
To validate this method, it had to be repeatable and reproducible with %CV of less than 20% for all IR protection factors. These objectives were achieved, as the maximum %CV for repeatability and reproducibility were 19.4% and 14.6%, respectively.
Furthermore, all color-containing products in the described tests showed positive results for IR protection. This seems to indicate pigments may improve IR protection in physical terms. This study also highlights the fact that SPF levels had no influence on levels of IR protection. Additional tests should therefore be performed to assess whether the fixed limits were too strict; the panel of products selected indeed comprised only a few IR-protective; or if the selected products provided IR protection via biological effects.
Based on the described method, a standardized logo should be proposed to be append product packaging. This will inform consumers that the product provides IR protection in accordance with a future international harmonization.
Acknowledgements: The authors wish to thank Alexandre Lauer, Delphine Roger, Axelle Casanova and Mary Sinoquet, of Chanel Parfum Beauté–Pantin, for their support; and Rudy Camart for performing a portion of the tests.
References
- E Dupont, J Gomez and D Bilodeau, Beyond UV radiation: A skin under challenge, $1 35, 224-232 (2013)
- S Grether-Berck, A Marini, T Jaenicke and J Krutmann, Effective photoprotection of human skin against infrared A radiation by topically applied antioxidants: Results from a vehicle controlled, double-blind, randomized study, Photochem and Photobiol 91(1) 248-50 (Jan/Feb 2015) doi: 10.1111/php.12375
- ME Darvin, S Haag, M Meinke, L Zastrow, W Sterryand J Lademann, Radical production by infrared A irradiation in human tissue, Skin Pharmacol Physiol 23(1) 40-6 (2010) doi: 10.1159/000257262
- P Schroeder, C Calles, T Benesova, F Macaluso and J Krutmann, Photoprotection beyond ultraviolet radiation—effective sun protection has to include protection against infrared A radiation-induced skin damage, Skin Pharmacol Physiol 23(1) 15-7 (2010) doi: 10.1159/000257259
- VC Gonzalez, AC Beheregaray, BM Peres, ES Sallis, AS Varela, Jr, and GS Trindade, Histopathological analysis of UVB and IR interaction in rat skin, Photochem Photobiol 91(4) 895-900 (Jul/Aug 2015) doi: 10.1111/php.12435
- Commission Internationale de l’Éclairage (CIE), available at www.techniques-ingenieur.fr/base-documentaire/electronique-automatique-th13/fondamentaux-de-l-optique-42448210/commission-internationale-de-l-eclairage-cie-r86 (Accessed Aug 30, 2017)
- Commission of the European Communities, Commission recommendation of 22 September 2006 on the efficacy of sunscreen products and the claims made relating thereto, available at http://eur-lex.europa.eu/legal-content/EN/TXT/PDF/?uri=CELEX:32006H0647&from=EN (Accessed Aug 30, 2017)
- Determination of sunscreen UVA photoprotection in vitro, ISO 24443:2012, available (for purchase) at www.iso.org/standard/46522.html (Accessed Aug 30, 201)
- L Ferrero, M Pissavini, A Dehais, S Marguerie and L Zastrow, Importance of substrate roughness for in vitro sun protection assessment, $1 9(2) (Apr/Jun 2006)
- M Pissavini, S Marguerie, A Dehais, L Ferrero and L Zastrow, Characterizing roughness: A new substrate to measure SPF, Cosm & Toil 124(9) (Sep 2009)
- S Miksa, D Lutz and C Guy, In vitro/vivo SPF correlation and repeatability according to substrate, Cosm & Toil 128(9) (Sep 2013)
- S Miksa, D Lutz and C Guy, In vitro UV testing—Robot vs. human spreading for repeatable, reproducible results, Cosm & Toil 128(10) (Oct 2013)
- S Miksa, D Lutz and C Guy, UV transmission assessment: Influence of temperature on substrate surface, Cosm & Toil 128(7) (Jul 2013)
- S Miksa, D Lutz and C Guy, Dynamic photostability test method for additional sunscreen claims, Cosm & Toil 131(1) (Jan/Feb 2016)
- ASTM G173-03, Reference Spectra Derived from SMARTS v.2.9.2, available (for purchase) at www.astm.org/Standards/G173.htm (Accessed Aug 30, 2017)
- A Duev, G Kelm, RR Wickett and OV Dueva-Koganov, Are SPF and critical wavelength sufficient to measure efficacy of sunscreen products against sun induced skin damage? Monographic Supplement Series: Sun Care, HP&C Today 8(4) (Jul/Aug 2013)
- OV Dueva-Koganov, A Duev, R Tumer and S Micceri, In vitro evaluation of potential protection provided by topical products against full solar and visible plus infrared radiation, HP&C Today 9(2) (Mar/Apr 2014)

