The Quantitative Descriptive Analysis (QDA) profile is a well-known method to qualify and quantify the sensory differences between products. QDA profiles provide powerful results for the sensory evaluation of food or non-food products, especially when a detailed sensory profile is required or where similar products are being compared.1
One disadvantage of the QDA profile, however, is the process for calibrating the panel. A long, intensive period is required to train panelists to understand different sensations, and to grade intensity differences similarly on specific scales. This step incurs costs and resources in order to achieve consistent results beyond the calibration time.2
New sensory tests were developed based on industry demand to obtain similar results to traditional descriptive sensory tests but faster and cheaper. These tests include the flash profile and projective mapping and sorting, which typically recruit untrained panelists, i.e., consumers,3-7 and require fewer sessions than the QDA profile.
More recently, a sensory test called Ranking Descriptive Analysis (RDA) was developed, whereby trained panelists rank four products on an ordinal scale, from least to most.8, 9 The RDA approach previously was validated for sampling chocolate pudding. Trained panelists assessed ten specific descriptive attributes regarding texture and taste.8 To the best of this author’s knowledge, the method has previously only been used to evaluate food. Here, the RDA approach is used to assess the sensory properties of four body creams, and compared with QDA profile results.
Methods
QDA profile: Panelists (n = 11) were calibrated on the QDA profiles of four cosmetic emulsions in weekly sessions over three months, to form an expert panel. They assessed attributes of the body creams during five steps in the application process: appearance in the packaging, pick up between the fingers, application on the skin, immediately following application on the skin, and two minutes after application on the skin.
The panelists used an unstructured linear scale of 10 cm to score each of 32 attributes, with zero corresponding to “not at all” and 10 corresponding to “very.” Note that for reasons of confidentiality, these specific attributes cannot be disclosed, here.
Samples were presented with a random three-digit code, balanced efficiently using the Latin Square randomization design. Panelists applied the body creams to their volar forearms, and assessments were performed independently under standard sensory testing conditions (i.e., controlled temperature and humidity, etc.).10 QDA data was collected, and product averages were calculated from the panelists’ assessments. Results were analyzed using two-way ANOVA followed by a Tukey test when significant differences were identified.
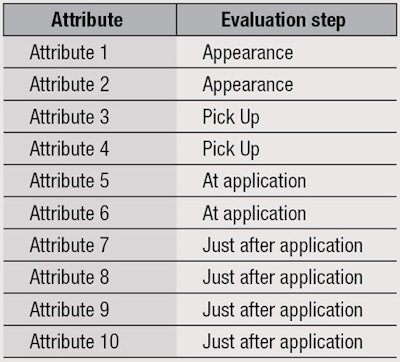
RDA profile: The same trained panelists (n = 11) performed the RDA study. They ranked the same four body creams evaluated in the QDA study on an ordinal scale, from “least” to “most.” Ten attributes from the 32 used in the QDA profile were selected for their relevance to sensory properties. These attributes were assessed at different phases, as shown in Table 1.
The RDA was performed one month after the QDA profile in order to maintain the panelists’ objectivity. Samples were again presented by a random three-digit code, different from the QDA profile, and balanced following Latin Square randomization. The four body creams were ranked simultaneously by the panelists; “ties” between samples were not allowed. Panelists applied the body creams to their volar forearms, and assessments were performed under the same controlled conditions as for the QDA profile.
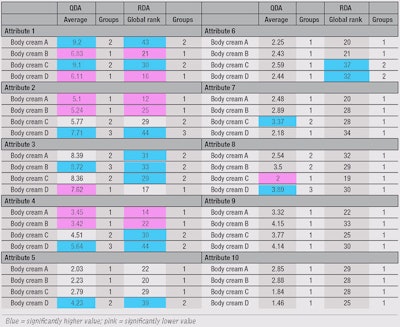
RDA data was collected for each of the ten attributes, as shown in Table 2, with ratings of “least” corresponding to 1 and “most” corresponding to 4. Global ranks were compared using the Friedman test, followed by a multiple comparison ranks test in the case of significant differences.
Results
Results from the two sensory tests were compared per attribute to validate the RDA approach (see Table 2). Note that only the results for the ten attributes listed in Table 1 were interpreted. Following are discussions of the similarities and differences in results between the two methodologies.
Similarities: Results from QDA and RDA were similar for attribute 1. Here, both methods defined two groups of body creams. The QDA profile showed body creams A and C were rated significantly higher on attribute 1 than body creams B and D. The RDA reached the same conclusion, as body creams A and C were ranked significantly higher on attribute 1, while body creams B and D were ranked significantly lower. Results between the methods also were similar for attributes 2, 5, 9 and 10, as far as the number and groupings of similar body creams.
The results for attribute 3 were globally the same between the QDA and RDA, although the number of groups into which samples were sorted differed. With the QDA profile, body cream B was found to be significantly higher on attribute 3 than body creams A and C, and body cream D was perceived as significantly lower on attribute 3. The RDA showed that body creams A and B were significantly higher on attribute 3 than creams C and D. Results also were globally the same for attribute 4.
Differences: The QDA results grouped the body creams differently than the RDA results for attributes 6, 7 and 8. For attribute 6, the QDA found no significant differences between the four body creams; i.e., all four were grouped together. However, using RDA, two groups of body creams were highlighted; creams C and D were found to be significantly higher on attribute 6 than creams A and B.
For attribute 7, results from the QDA highlighted body cream C as significantly higher than body creams A, B and D. This was not confirmed by the RDA, though, as no significant differences between the four body creams were found.
For attribute 8, QDA found body cream C to be significantly lower than body creams A and B. Also, body cream D was significantly higher on attribute 8 than creams A and B. However, the RDA did not highlight any significant differences between the four body creams.
Discussion
The QDA profile and RDA approach showed similar results for seven of the 10 attributes, validating RDA for the body cream evaluations. The results were exactly the same for attributes 1, 2, 5, 9 and 10, and were globally the same based on the two statistical treatments, ANOVA and Friedman test, for attributes 3 and 4. Only attributes 6, 7 and 8, showed different outputs between the two sensory tests.
Regarding attribute 6, RDA ranked the body creams into two groups whereas the QDA did not. This could be due to the fact that the RDA protocol was based on evaluating the four body creams at the same time, which appears to be a more powerful approach for this attribute. A potential next step could be defined by assessing nine new attributes to fully validate the results from attribute 6 and identify potential powerful attributes for the RDA.
For attributes 7 and 8, the RDA seemed less discriminative but this may have been due to the two attributes being more difficult to assess at the same time for all four body creams. For example, attribute 7 related to the instant feeling perceived just after application, and perceiving this for all products simultaneously could have posed a challenge. In addition, attribute 8 relied on a visual assessment, which could have been impacted by both the application of the product to the forearm and the angle of light reflection. Thus, for these two attributes, only the QDA profile identified perceived differences in the body creams.
Globally, the RDA approach enabled the comparison of four products simultaneously using a ranking procedure that almost anyone could perform.11 While the present study used trained panelists, a potential next step would be to recruit consumers, and since ranking is a simpler task, only shorter initial training times would be necessary to ensure consumers understand the attributes they are ranking. This is a key difference from the QDA profile, which requires longer training to enable panelists to differentiate the sensations and precisely use intensity scales in a consistent manner.
Moreover, concerning data collection and ranking interpretation, the RDA process takes less time than QDA profile data collection, and the interpretation of results can be managed by non-sensory specialists using pre-defined templates. Furthermore, the Friedman test and multiple comparisons of ranks are not complex statistical calculations; these could be performed with statistics tables or Microsoft Excel. Other dedicated software for the collection and treatment of data is not required to obtain results. On the contrary, ANOVA followed by a Tukey test or principal component analysis, which usually are performed with sensory data from QDA profiling, are relatively complex analyses, so these calculations generally are performed by a sensory scientist or statistician.
On the other hand, while the RDA results provided global and comparative information between the four body creams for ten attributes, these results were not as precise as the grades or detailed sensory profiles obtained on the 32 attributes from the QDA profile. The QDA approach also allows product evaluations to be performed at different points in time on multiple products, since the panel is consistent and calibrated, then the results can be analyzed and compared all at once. The RDA method does not allow for the comparison of more than four products at the same time, and this fact could be a constraint in the product development process when several products need to be evaluated.
Overall, however, the applied RDA method has broad cosmetic applications and could have a positive impact on approaches to sensory testing for product development. It also could be applied beyond body creams; for example, in color cosmetics, to evaluate foundations and lipsticks. Of course, depending on the product being assessed, descriptive attribute selection criteria would change.
Conclusion
The present article describes the application of RDA for cosmetic product sensory analysis. It demonstrated comparable results on seven attributes and has great potential for enabling non-sensory specialists to perform quick sensory tests to rank products from “least” to “most.”
The test could be used as an easy, quick and cost-effective alternative to QDA profiling to assist in product selection during the development. Validated for use in this body cream assessment, the RDA method is anticipated to have much broader cosmetic applications.
Acknowledgements: The author would like to thank the Oriflame expert emulsion panel and Julie Djian for their participation. She would also like to thank the Ori-Derm team for their support, and Emma Koncewicz, Rachel Mallon and Eve Merinville for their constructive comments.
References
- H Stone and JL Sidel, Sensory Evaluation Practices, GCI (2004)
- GV Civille and AS Szczesniak, Guidelines to training a texture profile panel, J Texture Stud 4(2) 204–223 (1973)
- S Chollet, M Lelièvre, H Abdi and D Valentin, Sort and beer: Everything you wanted to know about the sorting task but did not dare to ask, Food Qual Prefer 22(6) 507–20 (2011)
- J Delarue and JM Sieffermann, Sensory mapping using Flash profile. Comparison with a conventional descriptive method for the evaluation of the flavor of fruit dairy products, Food Qual Pref 15(4) 383–92 (2004)
- V Dairou and J-M Sieffermann, A comparison of 14 jams characterized by conventional profile and a quick original method, the flash profile, J Food Sci 67(2) 826–34 (2002)
- J Pagès, Collection and analysis of perceived product inter-distances using multiple factor analysis: Application to the study of 10 white wines from the Loire Valley, Food Qual Prefer 16 (7) 642–9 (2005)
- A Albert, Overcoming the issues in the sensory description of hot served food with a complex texture. Application of QDA, flash profiling and projective mapping using panels with different degrees of training, Food Qual Pref 22(5) 463–73 (2011)
- V Richer, T De Almeida and S Prudencia, Proposing a ranking descriptive sensory method, Food Qual Pref 21(6) 611–20 (2010)
- N Rodrigue, M Guillet and M Fortin, Comparing information obtained from ranking and descriptive tests of four sweet corn products, Food Qual Pref 11(1-2) 47-54 (2000)
- Sensory analysis—General guidance for the design of test rooms, ISO 8589 (2007)
- H Kildegaard, E Tonning and AK Thybo, Preference, liking and wanting for beverages in children aged 9–14 years: Role of sourness perception, chemical composition and background variables, Food Qual Prefe 22(7) 620–627 (2011)
