Stratum corneum (SC) adhesive tape stripping has been utilized in the measurement of SC mass, barrier function, drug reservoir and percutaneous penetration of topical substances for nearly 50 years. The process involves a methodical, relatively noninvasive layer-by-layer removal of the outermost epidermal cell layers. Complete SC removal may require more than 70 tape strips.1, 2
The quantity of SC harvested diminishes with each sequential strip, possibly due to increased SC cohesiveness in deeper layers. Thus, the mass of any single strip depends upon the mass removed by the prior strip. SC removal may rely on the interaction between the adhesive stripping force and the cohesive intercellular force.3
In this article, several methods to quantify the protein collected by tape stripping are described, including traditional gravimetric methods as well as novel colorimetric and visible spectroscopic techniques. Further, one colorimetric method is described to effectively determine the keratolytic efficacy of various materials in vivo, suggesting additional roles for this method.
Biological Response to Tape Stripping
Tape stripping was first devised in the 1940s. In 1951, Pinkus demonstrated a remarkable burst of mitotic epidermal activity post-stripping and concluded that the lost horny layer is replaced by basal mitotic division.4 The degree of hyperplasia correlates with the level and duration of barrier disruption.5 Nevertheless, the mitotic rate may remain five times greater six days after stripping than at baseline.6 This keratinocyte hyperproliferation may be a response to water barrier disruption or cytokine release secondary to epidermal injury.5, 6
Adhesive stripping increases epidermal lipid synthesis, lamellar body production/secretion in the stratum granulosum, epidermal DNA synthesis, epidermal cytokine production, dermal inflammation, and the presence of TNF and IL-1α in skin.6 Conversely, the occlusion of stripped human skin via adhesive application suppresses mitotic activity; adhesive occlusion may therefore provide an artificial restoration of the lost barrier. Similar experiments in mice, however, do not support these findings.6
Tape Stripping and TEWL
The SC is composed of annucleated, keratin-rich corneocytes embedded in an extracellular multilamellar lipid matrix organized into membrane-like bilayers, in which inter-corneocyte communication occurs through desmosomes.7 Ceramides, cholesterol and free fatty acids comprise the lipid matrix of the SC, providing invaluable roles in barrier structure and function.7 However, lipid levels decrease in aged human skin, possibly due to an increase in pH of the SC and subsequent lipid processing impairment.7
The SC provides the rate determining step for the passage of most molecules across skin.8 Therefore, the concentration of topical agents within the SC is directly related to that in the epidermis and dermis, the typical target sites. Additionally, corneocytes and intercellular lipids are responsible for preventing excess transepidermal water loss (TEWL),9 which can be measured with an evaporimeter and is frequently used to assess skin barrier integrity.9
Anatomically, regional SC variations in percutaneous drug absorption, lipid composition, TEWL measurements, mean thickness, and number of cell layers have been described. Yet, despite this structural heterogeneity, each layer of the SC equally contributes to the prevention of water loss.9 In doing so, the SC behaves as a membrane that is compatible with Fick’s laws of passive diffusion. Therefore, it is possible to calculate water diffusivity across the SC.9
TEWL increase as a function of tape strip number depends on factors such as anatomical site, pressure, pressure duration and tape removal rate.10 Loffler et al. demonstrated that TEWL increased fastest on the forehead, followed by the back and the forearm.10 These findings may be explained by variations in SC thickness, differences in spontaneous desquamation (SC cohesion), and pressure resistance due to inherent viscoelasticity and type of tissue underlying the skin.10 Rapid removal, shorter pressure duration (2 sec vs. 10 sec) and higher pressure (330 g cm-2 vs. 165 cm-2) all more readily produced TEWL increases.10
A similar study by Breternitz et al. revealed the greatest increase in TEWL on the cheek, compared with the back, upper arm and forearm.11 Interestingly, the cheek also demonstrated the greatest increase in SC hydration after stripping.11 The researchers further established a greater, earlier TEWL increase with higher pressure (7 N stamp vs. 2 N) and longer application (10 sec vs. 2 sec).11 Moreover, using the thumb, stretching the skin and utilizing a roller or stamp all resulted in varying quantities of harvested SC.11 Use of the thumb removed the greatest amount of SC and produced the highest TEWL, even when compared with the use of a roller or stretching the skin. Occlusion of the test site prior to the stripping procedure also resulted in higher TEWL values.11 In conclusion, reliable, reproducible results depend upon the standardization of the aforementioned variables.
Kalia et al. found that initial tape strips removed thicker layers of the SC, relating this to a decreased number of desmosomes closer to the skin surface.8 The researchers demonstrated decreased impedance with increasing depth and thus theorized that the removal of the upper corneocyte layers and lipid matrix diminishes structural opposition to ion flow, facilitating ion transport. In addition, TEWL was found to increase disproportionally with later tape strips, and the removal of only the upper layers of the SC was insufficient to significantly enhance water loss.8
The removal of 6-8 µm of deeper layers of the SC typically resulted in significant TEWL increases.8 In contrast, removal of the outermost layers affected impedance more than TEWL, with a 40% decrease in impedance after removal of only 4 µm of SC. Nonetheless, a correlation between TEWL increase and impedance decrease was observed. Upon completion of the tape stripping experiment, the full return to basal values of impedance occurred after 3 days while TEWL recovery time took 5-6 days. External layers, more crucial in impedance, were formed prior to deep compact layers.8
These findings by Kalia et al. suggest a gradation in water-regulating ability within the SC, with the deepest layers most responsible for controlling water flux. However, via simple mathematical deduction, these results support a Fickian model.8 Though structurally heterogeneous and complex, the SC behaves as a homogenous barrier to water in vivo. The water transport route may be homogeneous throughout SC, with each layer contributing equally to the barrier.8
In fact, if the experimental TEWL values are plotted as a function of tape stripping frequency in a best-fit curve, it closely resembles a theoretical curve based on Fick’s first law of diffusion.12 The first half of the theoretical curve fits the actual curve; in the second half, experimental data shows slightly higher TEWL values than Fick’s theoretical values.12 The authors of the study offer plausible explanations for this discrepancy.12
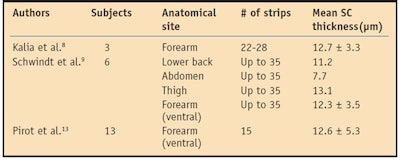
In contrast to most studies, Schwindt et al. demonstrated that the quantity of harvested SC was constant with each strip in a given anatomical site and volunteer.9 They found a linear relationship in all anatomical sites between 1/TEWL and the total mass of removed SC, further establishing that the SC acts as a Fickian membrane for steady state water diffusion. Their work also suggests that intercellular lipids, not corneocytes, are the determining factor for SC water diffusion.9 This linear relationship was described by Pirot et al., plotting 1/TEWL as a function of SC thickness (13 subjects examined).13 Table 1 summarizes the results from the Kalia, Schwindt and Pirot studies quantifying SC thickness.
Varying Adhesive Tapes
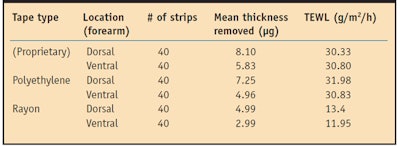
Tape construction influences the outcome.11 Three different adhesive tapes—one based on rayon, another on polyethylene, and a third proprietary adhesive tape—utilized in vivo showed statistically equivalent mean water diffusion coefficients, SC permeability and SC mass/thickness removal;3 however, after 40 strips, the proprietary adhesive stripped the most while the rayon adhesive stripped the least.3 TEWL increased significantly as deeper SC layers were reached with the proprietary and polyethylene adhesives but not with rayon tape.3
Tape properties, subject properties or a combination thereof may account for the variations in barrier disruptive properties. Variations may also be accounted for by unique adhesive systems; adhesives of different tape brands may bind similarly to cellular SC but differently to extracellular components of the SC barrier. These extracellular components such as free fatty acids, ceramides and lipids are essential to barrier function.
Furthermore, 5-7 µm of SC removal resulted in significant TEWL elevations, a depth unobtainable by the rayon tape (see Table 2).3 This implies that structural elements of the water barrier may not be homogeneously distributed. In some subjects, neither the proprietary adhesive nor the polyethylene adhesive disrupted the water barrier. These individuals experienced no barrier disruption at any of the six tested sites, suggesting the variation of water barrier disruption to be a function of the individual.
Demonstrating that removal of the same amount of SC from different individuals does not result in similar increases in TEWL, Kalia et al. asked whether this variation was secondary to differences in intact membrane thickness between individuals.14 These researchers demonstrated that once differences in the thickness of the intact SC between individuals are normalized, the same degree of barrier disruption induces the same increase in TEWL in each individual.14
Normalizing the SC thickness involves removing SC with respect to the calculated total SC thickness. Therefore, removal of the same percentage of SC in two individuals results in equivalent barrier disruption. TEWL rises considerably only after about 75% of the SC has been removed, presenting a consistent barrier to water loss in the healthy human population.14
Measuring Protein Samples
After the harvesting of SC onto adhesives is complete, several methods can be used to measure the collected protein. For decades, weighing (gravimetry) was the preferred method despite the inconvenience of weighing before and after stripping under constant hydration conditions. Additionally, results were subject to inflation secondary to absorption of exogenous (topically applied) or endogenous (sebum, sweat and interstitial fluid) substances within the SC; typically initial strips were most affected by this absorption.
Little more than a decade ago, a novel colorimetric method was developed and validated by Dreher et al.15 This method relies on a protein assay similar to one developed by Lowry et al. more than half a century ago. Lowry’s method involved the measurement of protein with a folin phenol reagent after alkaline copper treatment.16 It was demonstrated to be simple, sensitive, specific and easily adaptable to small scale analyses, making it suitable for the measurement of miniscule absolute protein amounts.16Dreher’s method relies on spectrophotometry and colorimetry based on the calibration of stained SC proteins to the corneocyte mass.17 Drawbacks of Dreher’s method include the time-consuming preparation of tape strips and the necessary destruction of the original strips.
The Bradford dye reaction, which relies on Coomassie Brilliant Blue G-250 dye, is similar to Dreher’s method. The dye binds protein, resulting in ionic and hydrophobic reactions with a spectral shift from reddish-brown to blue. The maximal absorption for the bound form of the dye is 595 nm, the optimal wavelength for colorimetric measurement once the reaction has occurred. Despite disadvantages (e.g., serial dilutions), it is a fast and generally reliable method for protein quantification.
Dreher’s colorimetric method has been successfully adapted to 96-well microplates, effectively shortening analysis time.18 It should be noted that limited areas of adhesive tape are not predictive of SC removal on the entire tape; therefore, SC distribution on the tape is not homogeneous.18
A pivotal study examined direct spectroscopic SC protein quantification via absorption in the visible range (595 nm and 600 nm), with and without staining of corneocyte aggregates, and in the UV range (278 nm).19 Correlation coefficients R2 were 0.71 and 0.74, respectively. The results demonstrated weak SC protein absorption with immense light scattering.19 The Coomassie Brilliant Blue protein coloring did not increase light absorption by SC proteins, and thus could not decrease interference secondary to light scattering.19 The absorption techniques utilized in this study could not accurately predict corneocyte aggregate quantity.
Later studies utilizing wavelengths of 430 nm established optical spectroscopy in the visible range as a sensitive and reproducible method for protein quantification.2 Absorbance in this range depends exclusively on the quantity of corneocyte aggregates and adequately reflects SC mass.2 Corneocyte aggregates adhering to tape strips decrease the transmission of visible light by scattering, reflecting and diffracting it. The resulting pseudo-absorption has been successfully correlated with the mass of removed SC particles.2
Absorbance measurements allow for the determination of absolute mass from corneocyte aggregates that are harvested via tape stripping. In addition, spectroscopic measurements are unaffected by topically applied substances, unlike gravimetric measurements—which explains the differences in mass detected using gravimetry in the most superficial strips.20
Practically comparing spectrally measured quantity (absorbance) with corneocyte aggregate weight requires correcting for any topical applications in the upper SC layers, interstitial fluids in the deeper SC layers, the “stack effect” that decreases absorbance, and the tape stripping procedure itself (e.g., nonhomogeneous removal of tape or incomplete tape contact with skin).2 Once these factors are corrected, primarily by excluding analysis of the most superficial and deep strips, R2 is equal to 0.93, demonstrating proportionality between quantification methods.2
A multicenter study involving 24 subjects found a correlation coefficient of R2 = 0.94 when comparing UV/VIS spectroscopy (430 nm) with conventional weight determination.20 Superficial (first five) and deep (19–23) strips were excluded on the basis of weight-enhancement. Application of an o/w emulsion, as a part of the study, inflated superficial strip weight, and intrinsic interstitial fluid increased deep strip weight.20 Nonhomogeneous strips and those subject to handling errors were excluded.20 Only 66% of total strips were utilized to determine the correlation coefficient.20 Weigmann et al. explain that pseudo-absorption/weight correlation can be extrapolated to the deepest layers of the SC.20
A recent study demonstrated a strong correlation (R2 = 0.92 and R2 = 0.95) between pseudo-absorption at 430 nm, and both protein absorption at 278 nm and absorption of Trypan blue-stained proteins at 652 nm.17 However, protein absorption at 278 nm was characterized by a weak band, implying its application was limited to tape strips with high amounts of corneocytes.17 Mass determination based on UV absorption was further limited by the potential super-positioning of strong absorption bands from exogenous substances and/or tape components in the same spectral range. Unlike the previous study, correlation was described using all tape strips (superficial and deep), regardless of adherent exogenous or endogenous components.17
Finally, Lademann et al. tested a corneocyte density analyzer, a reportedly inexpensive, reproducible optical device based on a slide projector, which also measures corneocyte pseudo-absorption at 430 nm.1 When compared with standard UV-visible spectrometric measurements, a correlation factor of R2 = 0.95 was demonstrated.1 This device may simplify the calculation of removed SC without the need for chemistry or a spectrometer. Additionally, the device includes a mechanical autofeed system that is well-suited for the handling of tape strips.1
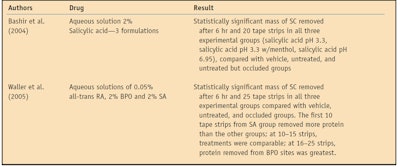
Colorimetric Assays for Keratolytic Classification Besides the assessment of proteins collected via tape stripping, colorimetry has successfully been employed to determine the desquamating effects of keratolytics. Table 3 presents the results obtained for three keratolytics from colorimetric protein assays, as described by Dreher et al.15 The process begins with cutaneous application of the agent. The agent is placed on a patch and taped onto the subject’s skin for a predetermined number of hours. After this period, the placement and removal of tape strips (number varies by study) onto the site of topical treatment is performed.
The assay involves the immersion and shaking of SC adhering tapes in sodium hydroxide solution, resulting in an extraction of the soluble SC protein fraction. The solution, now containing SC protein, is neutralized with hydrogen chloride, since the assay is ineffective under strong alkaline conditions. The assay is then performed using a protein assay kita and following a prescribed procedure. This assay is similar to the Lowry assay and is based on the reaction of protein with an alkaline copper tartrate solution and Folin reagent. Finally, absorbance at 750 nm is measured using a spectrophotometer.b This method allows for the quantification of microgram amounts of SC, diminishing confounding factors, namely vehicle and water uptake by the SC.
The protein measured using the assay described can be compared amongst groups, with statistical analyses allowing the determination of strong and weak keratolytics. SC removal via tape stripping in treatment and control groups is attributable to keratolytic mechanisms, which loosen SC cohesion. The disintegrated SC is subsequently collected by the adhesive. In the first keratolytic bioassay using this technique, salicylic acid (SA) was examined as a function of pH.21 The test preparations were: an aqueous vehicle control of pH 7.4; 2% SA aqueous solution of pH 3.3; 2% SA aqueous solution of pH 3.3 with menthol; and 2% SA aqueous solution of pH 6.95.21 A statistically significant mass of SC was removed after 6 hr, and 20 tape strips in all three experimental groups were compared to vehicle, untreated and untreated but occluded groups.21 However, after 10 strips, the SA pH 3.3 solution with menthol and the SA pH 6.95 solution removed significantly more SC than any other group, including the SA pH 3.3 solution.21
This data suggests that a neutral preparation of SA resulted in a pronounced keratolytic effect. Moreover, the neutral preparation was associated with the least skin irritation among treatment groups.21 This finding differs from that of a previous study, which demonstrated superior SA skin penetration in an acidic solution compared to neutral solution.22
In the second bioassay using this technique, SA, benzoyl peroxide (BPO) and retinoic acid were examined.23 The test preparations were: 0.05% all-trans retinoic acid; 2% salicylic acid at pH 6.95; 2% BPO; vehicle; untreated skin; and occluded but untreated skin.23 After 3 hr of treatment, only the BPO treatment removed significantly more SC on 25 strips than untreated skin, while the other treatments did not achieve statistical significance.23 At 3 hr, SA had greater SC amounts removed in the first 10 (superficial) strips, while deeper strips (11–25) demonstrated BPO to have the greatest SC removal.23 Statistically significant masses of SC were removed after 6 hr and 25 tape strips in all three experimental groups, when compared with the vehicle, untreated and occluded groups.23 At 6 hr, the first 10 tape strips from the SA group removed more protein than the other groups. At 10–15 strips, all treatments were comparable, and at 16–25 strips, BPO removed the most protein.23
These in vivo human results indicate that all treatments tested are effective keratolytics, which may account for their effectiveness against Acne vulgaris. Furthermore, it appears that SA may be a more suitable treatment for mild, superficial acne while BPO may be optimal for deeper, inflammatory acne. The ability of BPO to loosen the SC at deeper levels complements its antimicrobial/anti-inflammatory properties, resulting in an effective anti-inflammatory agent for papulo-pustular acne. Additionally, BPO appears to be effective even with short-term administration. RA had inferior SC disruption at 3 hr but significant disruption at 6 hr, indicating time-dependent keratolytic effects, consistent with its complex nuclear receptor interactions and alteration of gene transcription.
Conclusion
The SC is a an efficient indicator of the percutaneous penetration of an active agent and/or excipient, based upon the work of Rougier et al.24 These researchers demonstrated the close relationship between what is present in the SC after 30 min of application, and what ultimately penetrates into the body in both hairless rats and humans. This provides a facile assay for Galenic formulation variables. Further, the SC integrity to water loss (TEWL) appears to mirror the ability of a chemical to penetrate inwardly. Therefore, individuals with high TEWL also have increased percutaneous penetration.25
Lastly, the importance of the approximate 15 SC layers in relation to cutaneous health is impressive. The stripping method provides insight into how this thin membrane functions, and this method should become an important part of cutaneous investigative biology. As previously mentioned, Waller et al. demonstrated the robust evaluation of keratolytics in vivo in man using tape stripping with a colorimetric protein assay.23 The SC is beginning to reveal some of its secrets but much remains to be done.
Reproduction of all or part of this article without expressed consent is prohibited.
References
Send e-mail to [email protected].
1. J Lademann et al, Penetration studies of topically applied substances: Optical determination of the amount of stratum corneum removed by tape stripping, J Biomed Opt 11(5) 054026 (2006)
2. H Weigmann et al, Determination of the horny layer profile by tape stripping in combination with optical spectroscopy in the visible range as a prerequisite to quantify percutaneous absorption, Skin Pharmacol Appl Skin Physiol 12(1-2) 34–45 (1999)
3. SJ Bashir et al, Physical and physiological effects of stratum corneum tape stripping, Skin Res Technol 7(1) 40–8 (2001)
4. H Pinkus, Examination of the epidermis by the strip method of removing horny layers. I. Observations on thickness of the horny layer, and on mitotic activity after stripping, J Invest Dermatol 16(6) 383–6 (1951)
5. M Denda et al, The epidermal hyperplasia associated with repeated barrier disruption by acetone treatment or tape stripping cannot be attributed to increased water loss, Arch Dermatol Res 288(5-6) 230–8 (1996)
6. LB Fisher and HI Maibach, Physical occlusion controlling epidermal mitosis, J Invest Dermatol 59(1) 106–8 (1972)
7. JM Jungersted et al, Lipids and skin barrier function—A clinical perspective, Contact Dermatitis 58(5) 255–62 (2008)
8. YN Kalia, F Pirot, and RH Guy, Homogeneous transport in a heterogeneous membrane: Water diffusion across human stratum corneum in vivo, Biophys J 71(5) 2692–700 (1996)
9. DA Schwindt, KP Wilhelm and HI Maibach, Water diffusion characteristics of human stratum corneum at different anatomical sites in vivo, J Invest Dermatol 111(3) 385–9 (1998)
10. H Loffler, F Dreher and HI Maibach, Stratum corneum adhesive tape stripping: Influence of anatomical site, application pressure, duration and removal, Br J Dermatol 151(4) 74–52 (2004)
11. M Breternitz et al, Acute barrier disruption by adhesive tapes is influenced by pressure, time and anatomical location: Integrity and cohesion assessed by sequential tape stripping. A randomized, controlled study, Br J Dermatol 156(2) 231–40 (2007)
12. PG van der Valk and HI Maibach, A functional study of the skin barrier to evaporative water loss by means of repeated cellophane-tape stripping, Clin Exp Dermatol 15(3) 180–2 (1990)
13. F Pirot et al, Stratum corneum thickness and apparent water diffusivity: Facile and noninvasive quantitation in vivo, Pharm Res 15(3) 492–4 (1998)
14. YN Kalia et al, Normalization of stratum corneum barrier function and transepidermal water loss in vivo, Pharm Res 17(9) 1148–50 (2000)
15. F Dreher et al, Colorimetric method for quantifying human stratum corneum removed by adhesive-tape stripping, Acta Derm Venereol 78(3) 186–9 (1998)
16. OH Lowry et al, Protein measurement with the Folin phenol reagent, J Biol Chem 193(1) 265–75 (1951)
17. U Lindemann et al, Evaluation of the pseudo-absorption method to quantify human stratum corneum removed by tape stripping using protein absorption, Skin Pharmacol Appl Skin Physiol 16(4) 228–36 (2003)
18. F Dreher et al, Quantification of stratum corneum removal by adhesive tape stripping by total protein assay in 96-well microplates, Skin Res Technol 11(2) 97–101 (2005)
19. E Marttin et al, A critical comparison of methods to quantify stratum corneum removed by tape stripping, Skin Pharmacol 9(1) 69–77 (1996)
20. HJ Weigmann et al, UV/VIS absorbance allows rapid, accurate, and reproducible mass determination of corneocytes removed by tape stripping, Skin Pharmacol Appl Skin Physiol 16(4) 217–27 (2003)
21. SJ Bashir et al, Cutaneous bioassay of salicylic acid as a keratolytic, Int J Pharm, 292(1-2) 187–94 (2005)
22. N Leveque et al, Comparison of Franz cells and microdialysis for assessing salicylic acid penetration through human skin, Int J Pharm 269(2) 323–8 (2004)
23. JM Waller et al, ‘Keratolytic’ properties of benzoyl peroxide and retinoic acid resemble salicylic acid in man, Skin Pharmacol Physiol 19(5) 283–9 (2006)
24. A Rougier et al, The hairless rat: A relevant animal model to predict in vivo percutaneous absorption in humans? J Invest Dermatol 88(5) 577–581 (1987) 25. J Levin et al, The correlation between transepidermal water loss and percutaneous penetration: An overview, J Control Release 103(2) 291-299 (2005)
